Week 9 – Drones (Miriam Harvey)

When the MJM20 course leaders designed this course, and posed questions for Week 9’s drone topic such as “Have you seen video footage from a drone? Why are drones so popular as present?” (Sourbati, 2019) it is unlikely that the use of drones to fight Covid-19 was anticipated. Drones have recently been used by police forces in a number of countries to enforce the new social distancing and isolation rules.

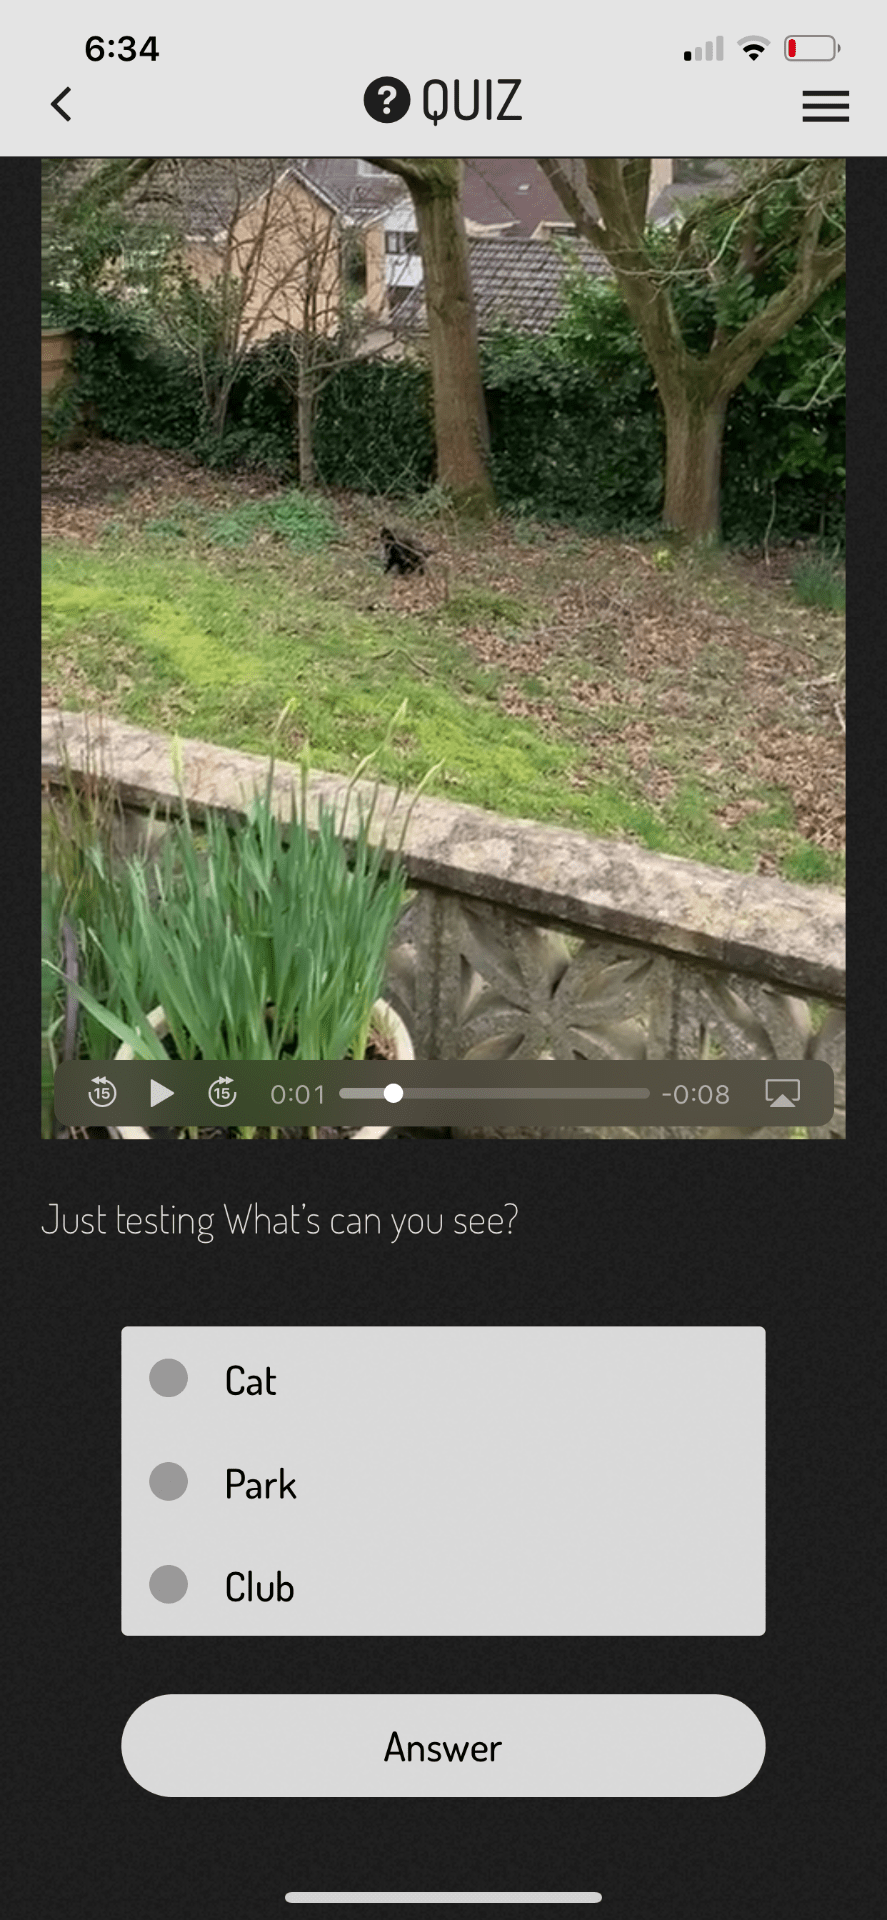
My case study for this week is Derbyshire Police’s (2020) Twitter post which included an annotated drone footage of unwanted visitors to the Peak District, during a public health lockdown period (see figure 1). This Twitter post was widely reported by news media (eg BBC, 2020; Pidd and Dodd, 2020; ITV, 2020). The remote location of the Peak District should be noted in this case because while surveillance cameras are standard fixtures in urban spaces, they have not previously been associated with the open countryside. A point for consideration is whether the drone, as used by Derbyshire Police, extended the boundaries of the digital city.

Twitter post by Derbyshire Police

Figure 1: @DerbysPolice Twitter post, 26 March 2020 [screenshot taken 28 March 2020]
https://twitter.com/DerbysPolice/status/1243168931503882241?s=20

Jensen (2016:71-72) proposes that there are six dimensions of surveillance, two of which are illustrated in this case study. Jensen’s first dimension is “Copresent humans” where humans watch humans, with the example given being police officers watching citizens. In the Derbyshire Police example, the drone is operated by police officers and the citizens being filmed by the drone would probably have been aware of a drone flying near them. However the viewing position would not have been “from the same vertical position”, as the drone footage clearly shows the camera angle looking down on the people and their cars. The position of the drone above the people is a position of power for the drone.

Jensen’s (2016:72) fifth dimension “Drone surveillance” highlights that drones “represent a mobile tracking and surveillance scenario, creating a very versatile and situational flexible surveillance system”. As noted above, this versatility extended the reach of police activity outside of what might have been considered the boundaries of the city. In his conclusion, Jensen (2016:73) poses some pertinent questions:

“What happens with our cities if the fifth dimension of surveillance becomes institutionalised as a standard operation procedure of surveillance? Seen from the point of view of the state apparatus, this means new and unseen potential for crowd control and surveillance. Seen from the point of view of the citizen, this means the end of public space as we know it.”

The question that I think was missing in Jensen’s paper was about the use of the drone surveillance footage after it was captured. Jensen focuses on the scene when the drone is operated, but as demonstrated by the Derbyshire Police Twitter post, the sharing and resharing of the annotated video succeeded in reaching a much wider audience and challenged the notion of public spaces and the perceived freedoms in such spaces.


References

BBC (2020). Coronavirus: Peak District drone police criticised for ‘lockdown shaming’. BBC, 27 March. Retrieved from https://www.bbc.co.uk/news/uk-england-derbyshire-52055201

Derbyshire Police (2020) @DerbysPolice Twitter post 26 March. Retrieved from: https://twitter.com/DerbysPolice/status/1243168931503882241?s=20 [accessed 28 March 2020]

ITV (2020). Derbyshire Police post video shaming people for breaching lockdown rules. ITV, 26 March. Retrieved from https://www.itv.com/news/calendar/2020-03-26/derbyshire-police-post-video-shaming-people-for-breaching-lockdown-rules/

Jensen, O.B., (2016) Drone city – power, design and aerial mobility in the age of “smart cities.” Geographica Helvetica, 71(67–75), pp.66–75, Denmark

Pidd, H. and Dodd, V. (2020). UK police use drones and roadblocks to enforce lockdown. Guardian, 26 March. Retrieved from https://www.theguardian.com/world/2020/mar/26/uk-police-use-drones-and-roadblocks-to-enforce-lockdown

Sourbati, M. (2019). ‘MJM20 Digital Cities Module Handbook – 2019/20’, University of Brighton School of Media, Brighton

Week 8: Digital Urban Gaming

I interviewed my friend, female, mid-20s who works in digital marketing and lives in Berlin. She did her undergraduate degree in Brighton and moved here from south Germany to do so, before moving to Berlin for work. Having experienced new urban environments, both in different countries and cities, I wondered if Pokémon GO! As a locative interaction was used to “promote discovery and use of spaces” or “a method of narrative feedback for players providing a voice for comment on their local area.” (Foth, Hudson-Smith, Gifford 21-22: 2016)

It was clear from her comments that, despite what the reading suggested, for my friend the use of the game was a “dichotomy” between ‘offline’ and ‘online’ worlds. (11: 2016) “I feel like I paid less attention to whatever was going on around me” she says, when describing her experience of playing Pokémon GO! “For me, once I got familiar with my space, I decided that I’m not going to pay attention to my surroundings too much. If it’s an area that I’m not familiar with, I would not use Pokémon GO!” This contradicts the theories that location-based games (or, at least, Pokémon GO!) can be used by players to become more engaged with their environment and gain ‘civic capital’. (15: 2016)

My friend’s experience falls more in line with Hjorth & Richardson (2017) suggesting that Pokémon GO! Is “manifestly ambient […] embedded in our daily routines.” (5: 2017) She says: “I guess a lot of it had to do with routine tasks, useless tasks, walking to the train station, walking to dinner […] that tend to be boring, but you make it fun.” Interestingly, my friend spoke not of her surroundings or her location but how she used the game “to bridge time, getting from A to B […] time went by faster when you played it, once you are familiar with the space.” The game was used more to change my friend’s experience with the time that it took to pass through urban space.

I revisit Foth, Hudson-Smith and Gifford who opened their paper: “top down deployment of these large and proprietary technology platforms may fail without a thorough understanding of the socio-cultural nuances of how people navigate and negotiate different urban environments.” (3: 2016) After speaking with my friend and knowing the success of Pokémon GO! It could be concluded that the makers of Pokémon GO! Have a thorough understanding of these nuances, but these nuances may, for the most part, have little to do with encouraging players to interact with and ‘experience’ their surroundings.


Foth, M. Hudson-Smith, A. Gifford, D. 2016. ‘Smart cities, social capital, and citizens at play: a critique and a way forward’ Research Handbook on Digital Transformations Edward Elgar Publishing ltd.

Hjorth, L. Richardson, I. 2017. ‘Pokémon Go: Mobile media play, place-making, and the digital wayfarer.’ Mobile Media & Communication Vol. 5 Issue 1, pp 3-14.

Week 6: City Dashboards and Open Data

According to Kitchin et al. (2015, p. 12), “the power of indicators, benchmarking and dashboards is that they reveal in detail and very clearly the state of play of cities.” Thanks to this power, people can get to know their city by the visualization and analysis made from the data. Indicators can be used to track the change of specific phenomenon. They are usually integrated with another index to provide the view for the whole contexts. In terms of cities, indicators serve as an instrument to gauge the cities’ performance. This is often illustrated by the charts of maps and can provide some forecast for the future trend. The indicator data is very helpful for the bodies to monitor and evaluate the efficiency of urban services and policy. This can also supports them to manage and govern the cities. There are two approaches for the cities to use these kinds of data. The first one is that they promote democracy and accountability and the second is that they enforce regulation to develop effectiveness.

The agenda generated by United Nations Conference on Environment and Development (UNCED) has pointed out that the indicators of sustainable development should be fostered for the officials to reach wise decision in terms of protecting environment and promoting economic at the same time. Following this, city officials and citizens’ community should figure out and invent the indicator data that suffice the needs of their areas.

Data analysis is involved in 11 fields of activities run by local officials. One area is for opening government, which means data is made to be transparent for those who require Freedom of Information policy in the North of England. Another field supported by data analytics is the transformation of public service in Newcastle. Thanks to this, social workers can keep track of the changes in children’s social care services and cope with complicated family needs in a better way. Beside this, “Leeds’s Innovation Labs provide a space for local developers to experiment with open data sets to solve social problems, and develop viable new products and services.” (Symons, 2016, p.7)


References:


Brighton & Hove City Council. ‘Brighton & Hove Community Insight’ <https://brighton-hove.communityinsight.org/map/>

Kitchin, R. Lauriault, T. & McArdle, G. 2015. ‘Knowing and governing cities through urban indicators, city benchmarking and real-time dashboards’ Regional Studies, Regional Science, vol 2 issue 1, pp 6-28.

Symons, T. 2016. Wise Council: Insights from the cutting-edge of data-driven local government. London, Local Government Association.


You This image requires alt text, but the alt text is currently blank. Either add alt text or mark the image as decorative.This image requires alt text, but the alt text is currently blank. Either add alt text or mark the image as decorative.This image requires alt text, but the alt text is currently blank. Either add alt text or mark the image as decorative.

Week -6 City Dashboards & Open Data

Dashboards

Dashboards are information management tools that are used to track the performances and other key data points relevant to a business, department processes. Through the applications of data visualizations, dashboards ease complex traffic data to provide road users with a glance awareness of current performance.

The use of dashboards to collect, analyze and display data in numerous ways in cities

City dashboards have drawn accumulative interest from both city workers and inhabitants. Dashboards have the capability of gathering, visualizing, analyzing and informing the local performance to support the viable growth of smart metropolises. Dashboards, therefore, provide expedient implements for assessing and enabling urban setup constituents and services. Dashboards provide a goal view of performance metrics and serve as an effective foundation for further dialogue. Moreover, the business aptitude tool is used to show data imaginings in a manner that if easily and closely understood.

The use of dashboards in measuring and monitoring

Geospatial dashboards offer fine grained measurements by providing views and factors driving the metrics. Dozens of cameras measure the nature of traffic that is moving in any given place in the city. The dashboard system provides an overview of the nature of commercial transport that is active in any given sector (Kitchin and McArdle, 119). The dashboard also provides the impact of transportation on air quality. Moreover, the dashboard provides the managers with an overview of how to keep the city clean and livable.

The use of data visualizations

Data visualization takes facts and converts them to visual context. Data visualizations convert data and make the information comprehensible for the human to detect outlines, movements, and outliers in clusters of data. Therefore, data visualization is important for maintaining and managing traffic from a central place. Data visualizations help in addressing the multivariate nature of spatiotemporal urban mobility data (Hui, 137). Furthermore, data visualization supports the analytical tasks of domain experts in the transport industry.

The kind of data used in visualizations is spatiotemporal data. This kind of data helps traffic managers to have a global understanding of urban traffic status in the level of a reading system. Spatiotemporal data, therefore, is useful in traffic regulation and route management.

Role of open data

Open data helps create smart cities through the provision of sustainable and efficient growth. The openness and availability of data create transparency to the administrations thus allowing greater creativity by the stakeholders to seek and develop traffic solutions.

Political and commercial agendas in artificial intelligence sites.

Artificial intelligence has been used by the government to access its transport and mobility services. Administrations have been adopting both the legislative and non-legislative initiatives in the field of AI. AI is potential purpose expertise which provides tremendous opportunities in the transportation industries and other fields. concisely, AI has substantial risks such as labor displacement, strategic instability as well as sacrificing safety and other transport values to the technology (Leszczynski 1703).


Reference Cited

Hui, Eric G. “Data Visualizations.” Learn R for Applied Statistics, 2018, pp. 129-172.

Kitchin, Rob, and Gavin McArdle. “Urban data and city dashboards.” Data and the City, 2017, pp. 111-126.

Leszczynski, A. “Speculative futures: Cities, data, and governance beyond smart urbanism.” Environment and Planning A: Economy and Space, vol. 48, no. 9, 2016, pp. 1691-1708, doi:10.1177/0308518×16651445.


Week 6: City Dashboards and Open Data

Open Data is the idea that data, mostly data about people and the movement of capital, can and should be collected and shared among companies, groups and individuals for the benefit of wider society. Open Data is based on the belief that accurate, relevant and plentiful data should be easily available for a variety of uses. The Open Data Institute teaches ethical and innovative ways of collecting data, primarily for business use, but it is also encourages smaller groups and individuals to use the data pools also. To quote their website: “We work with companies and governments to build an open, trustworthy data ecosystem.”

I have chosen the Brighton & Hove Community Insight dashboard for my case study. Kitchin et al. argue that city dashboards, “rather than reflecting cities, actively frame and produce them.” (2015: 6) This can be problematic for open data sources. The Brighton & Hove Community Insight dashboard has little transparency on where the data comes from, and difficult to tell if it is updated monthly as it claims. There is no consistency to how the data is presented.

As you change the filters on the city dashboard, the way the data is presented varies wildly. Under ‘communities and environment’, the communities are described in a euphemistic and journalistic tone.

‘indices of deprivation’ clearly comes from a different data source, is more specific and scientific.

City dashboards, as Kitchin argues, are often “assumed to have no inherent politics or ulterior agenda and can be taken at face value.” (2015: 16) When open data is presented in the way it is here, inconsistent and journalistic in tone, the data can be interpreted as face value. Frameworks and actions taken by decision-makers are then re-produced, meaning the inconsistent, journalistic and ultimately biased data is re-produced and re-presented through other indicators, benchmarks and dashboards.

Symons (2016) explores how councils are collecting data on citizens through mobile apps, third party data, social media and low-cost sensors. One example is in Bristol City Council, who are collecting data on damp in houses through ‘Frog Boxes’.

a politically charged frog box

Although the reasoning given for increasing data collection across councils resonates with that of the Open Data Institute and cities who run a city dashboard, the results for the citizens themselves are framed differently. The data collected by ‘Frog Boxes’ aims to “help them solve identified issues of damp and challenge landlords to take action” which empowers residents with data and knowledge to assert their rights as tenants, but also to “give residents the ability and tools needed to fix problems themselves, rather than be reliant on the council.” (2016: 28)

The second point suggests a political ideology that moves responsibility of social housing maintenance away from the state and on to the individual, whatever their circumstance or the state of the building they are renting. The data collected by the council is, as Kitchin illustrates, “full of values and judgements shaped by a range of views and contexts.” (2015: 18)


Brighton & Hove City Council. ‘Brighton & Hove Community Insight’ <https://brighton-hove.communityinsight.org/map/> accessed 11/03/2020

Kitchin, R. Lauriault, T. & McArdle, G. 2015. ‘Knowing and governing cities through urban indicators, city benchmarking and real-time dashboards’ Regional Studies, Regional Science, vol 2 issue 1, pp 6-28.

Symons, T. 2016. Wise Council: Insights from the cutting-edge of data-driven local government. London, Local Government Association.

Week 6 – City Dashboards & Open Data (Miriam Harvey)

This week’s topic explores how cities use ‘dashboards’ to collect, analyse and display data in various ways.

Kitchen et al (2015: 6-7) set the scene:

“Since the early 20th century, social and economic indicators, such as unemployment rate [and] inflation […] have been used by governments to assess how a nation is performing (Godin, 2003). Likewise, in the post-Second World War era, many supranational agencies […]  measure, collate, and track the performance and productivity of various health, economic, and social phenomena across nations and regions.”

“Since the turn of the millennium, these indicator suites have been accompanied by numerous city benchmarking projects that compare and rank the relative performance of cities against one another. […] Whilst many urban indicator and benchmarking projects are relatively closed in nature […] there has been a recent move to open up the data underpinning indicators and share them with citizens through online, interactive data visualizations, often termed ‘city dashboards’”.

An example of such a dashboard can be viewed at https://data.london.gov.uk/ which describes itself as “a free and open data-sharing portal where anyone can access data relating to the capital” (London Datastore, n.d.). Figure 1 shows examples from the health section of this website, where data has been selected to support the Greater London Authority (GLA)’s promotion of London as a healthy place to live.

These graphs show a trend of life expectancy at birth being increasingly higher in London compared to England and Wales, and mortality rates declining and lower in London compared to England. It should be noted that data for Wales is only included for the life expectancy at birth comparison, even though mortality rates for England and Wales are publicly available from the Office of National Statistics. This raises the question of whether the GLA are distorting the image of London by excluding the Welsh mortality rates, to support their narrative.

An increase in childhood obesity is highlighted in the text about health, and the graph displays the data in an exaggerated way to imply that it is much higher in London compared to England. The scale used in different graphs are inconsistent. It may be highlighted to support a decision to prioritise work and funding for this issue. The tooth extraction for children graph lacks meaning as it has no comparison to other geographical locations or historic records, although it could be seen as being linked to childhood obesity if it is caused by an unhealthy diet. Kitchin et al (2015:14) note that “some municipalities use indicator and benchmarking initiatives to underpin forms of new managerialism, wherein they are used to guide operational practices with respect to specified targets and to provide evidence of the success or failure of schemes”.

Screenshot of health data from London Datastore

Figure 1: Screenshot of some of the health data graphs displayed on https://data.london.gov.uk/

The data used by the GLA is selective, and the way it is displayed is inconsistent. According to Kitchin et al (2015:18), the “indicator, benchmarking and dashboard initiatives […] do not simply act as a camera reflecting the world as it is, but rather act as an engine shaping the world in diverse ways”. This dashboard demonstrates an attempt to influence people’s perceptions of London. By presenting the dashboards as factual evidence, the GLA is using data to give credibility to their claim that London is well governed and successful.


References

Kitchin, R., Lauriault, T.P. & McArdle, G., (2015). Knowing and governing cities through urban indicators, city benchmarking and real-time dashboards. Regional Studies, Regional Science, 2(1), pp.6–28.

London Datastore (n.d.), Greater London Authority (GLA). Available at https://data.london.gov.uk/


Week 5 – Locative Narrative + Actionbound (Miriam Harvey)

“spaces we move through are media that tell stories” (Ritchie, 2013)

Ritchie (2014:53) describes “transmedia” stories [which] “blur the line between storyworld and physical world, requiring that authors tell stories across a variety of media, including architectural space and the physical environment.” My case study this week is an actionbound I have built on a web browser and played on a mobile phone to gain first hand experience of designing and using media that can “blur the line between storyworld and physical world”.

My actionbound topic is a dog walk, because it is a daily activity which does not obviously or intrusively involve technology. The walks are a simple physical exercise, so I was interested to see how the actionbound I designed could add a new dimension of “navigating across digital and physical spaces” (Ritchie, 2014: 65).

Ritchie (2014: 55) explains that “design choices and materials of everyday things afford and constrain the behaviors of users”. In this case study, the affordance I experienced from playing the bound was the gamification. An uneventful walk through quiet streets and empty parkways became a game, and therefore more interesting. There was though an effort required to play the game, which Ritchie (2014: 57-56) describes as “”nontrivial effort””. He warns that “the narrative must offer a reward perceived to be greater than the effort required by the audience” and I don’t think my simple actionbound achieved that.

My actionbound started with an ‘information’ screen to introduce the bound and a ‘mission’ to ‘evidence’ that the player was ready for the dog walk by uploading a photograph taken on the phone’s camera of poo bags and a dog lead. It included a ‘find spot’ [figure 1] using the phone’s ability to use GPS and a map displayed in the app; a second ‘mission’ to find a specific location based on text description and a photograph [figure 2] and upload a similar photograph. There was also a ‘scan code’ [figure 3] to ‘evidence’ that a poo bin was reached in the trail. It concluded with a ‘quiz’ to gauge the time taken to complete the dog walk. The results can be seen in Figure 4.


The experience of playing the bound made me aware of the two distinct worlds of the digital space and physical space. For most of the walk, the digital space was a passive overlay on the physical environment. The “digital bridges” (Ritchie: 2014: 63-64) of finding a spot through GPS and map or text description and photograph, and scanning QR code were active elements that made the story more engaging as a user and demonstrated the “co-authoring” (Ritchie: 2014: 65) aspect of transmedia storytelling.

The actionbound was played in public areas – public roads and public parks, maintained by the local town authorities. I felt like I was appropriating public space for private use when playing the game because I was using the space in a manner that is different to the way I expect it is intended. Adding a QR code to a poo bin was the strongest appropriation because I was making a (temporary) physical change to public property. Berry et al (2013:3-5) points out that there are many ways to understand the term “public” and “[t]he traditional idea of space … has become fundamentally problematized by the presence of media distributing and redirecting data flows that transverse the boundaries of an enclosure”.  Therefore, what I perceived as a private use of a public space could instead be understood as a creation of a new dimension of a public space; the production of a “heterogeneous space” that is “comprised of diverse things and qualities”.


References

Berry, C., Harbord, J. & Moore, R.O., (2013). Public space, media space, Basingstoke: Palgrave Macmillan

Ritchie, J. (2013). Ch. 4: Wayfinding on Campus, The mobile story. Available from: http://themobilestory.com/ch-4-wayfinding-on-campus/

Ritchie, J. (2014). The Affordances and Contraints of Mobile Locative Narratives. In The Mo- bile Story. Narrative Practices with Locative Technologies, ed. J. Farman, 53–67. Oxon: Routledge.


Week 5: Locative Narrative & Actionbound

Having lots of history around my area, I wanted to create a Bound that would allow the ‘reader’ to discover historical locations in Brighton.

Upon testing my Bound, I knew immediately that I had not included enough directional information or context to the locations I was giving. All that was available to me, as the test reader, was a directional arrow followed by a request to take a picture of where the arrow had taken me to. Not suitable for someone new wanting to learn about the area. This was the key constraint that I found when testing my Bound, a semantic constraint (Ritchie, 2014: 55) caused by not giving enough meaning to the space I was asking the player to move through. As Ritchie notes: “The events of the story influence the audience’s understanding of different spaces in which the story takes place.” (2014: 65) By not giving enough information on events of both Brighton’s history or the events of the Bound (i.e where the next location was) the Bound itself became a meaningless trek through unfamiliar space, and lost the narrative that the Bound was intended to create.

Not the best weather for it!

In my Bound I included links to local websites (The Argus, Brighton Museums) which gave more detailed information about the locations featured in the Bound. I also added some ‘Quiz’ questions about the locations such as names and dates, meaning the reader must engage with the online links alongside the buildings to continue the Bound. The reader moves through both digital and physical spaces simultaneously to push the narrative forward. This links to Ritchie’s ‘narrative value threshold’: “digital media has more interactivity, so the audience has to put more effort in to continue the narrative and complete the ‘story’.” (2014: 57) Actionbound is the perfect example of a transmedia narrative that requires a higher narrative value threshold.

13 Victoria Street, the final location in my Bound

By using Actionbound in any given location, it changes the nature of the space we experience. Actionbound is made from code, and when that code carries the reader through space, giving it new meaning – for example, an ordinary house changes into a site of social and political importance – that relationship between code and space, between media space and public space, becomes blurred. That space the reader has visited will forever be changed now, because of the overlay of code that has become embodied into the space via our locative media technologies. As Berry notes: “What we understand as media networks and media domains are not to be imagined simply as counter-forums to regulated public space or prosthetic adjuncts to what occurs in cities; rather, they are part of the material and experiential formation of what now constitutes life in public spaces.” (2013: 1)

Above is the QR code for my Actionbound, or you can access it here.

Berry, C., Harbord, J. & Moore, R. 2013. ‘Introduction’ Public space, media space.Basingstoke, Palgrave Macmillan pp 1-15.

Ritchie, J. 2014. ‘The Affordances and Constraints of Mobile Locative Narratives’ in The Mobile Story: Narrative Practices with Locative Technologies ed. Farman, J. Abingdon, Routledge.

Week 5 – Locative Narrative + Actionbound

The possibility of story-telling through media relies on how the media are used for expressing the stories and how it is constrained. According to Ritchie (2013, p.65), “mobile locative narratives only come into being through the decisions and efforts of audiences.” It means that audiences need to have the navigation in both physical and digital spaces to determine the factors related to the story. By this way they can achieve understanding and can even co-author a story. This requires significant effort. Therefore, to bring about these interactions, it is a duty of mobile locative narratives to give the audiences the medium for seeking information and narrative bridges. In this sense, the transfer between physical and digital can be considered the strain between these kinds of narratives. They provide descriptions and explanations to each other, which means that the location or objects that are mediated digitally are constricted and defined through “an implicit or explicit act of chronologically or causally creating a sequence of events” (Ritchie, 2013, p.65). In conclusion, there is a control over the chronological possibility of constructed and digital settings if one narrative or varied narratives are enforced on the other.

Hochman and Manovich (2013) has conducted a research to examine the living experience of people who use media sharing software and the way visual social media demonstrate the lives of a community or each person. It also sheds light on the elements that this data cannot resonate. The results reveal the conceptual cultural change in how people recognize and use the cultural information on the Internet. Lately, cultural software devices, in our case like actionbound (in this article it was talking about Instagram), do not put much emphasis on arranging information into specific types or structures. Alternately, they allow users to discover and explore the data in both spatial and temporal dimension. For instance, social networking sites like actionbound (or Instagram as mentioned in the article) enable users to find images by utilizing hashtags, sites, or by following other users, instead of just use hierarchical subject genres.


References:

  • Hochman, N. & Manovich, L., 2013. Zooming into an Instagram City: Reading the local through social media. First Monday, 18(7). Available at: http://firstmonday.org/ojs/in- dex.php/fm/article/view/4711
  • Ritchie, J. 2014. The Affordances and Contraints of Mobile Locative Narratives. In The Mo- bile Story. Narrative Practices with Locative Technologies, ed. J. Farman, 53–67. Oxon: Routledge.
Creating my own quiz on actionbound.

My Quiz on actionbound,
I was able to upload a short film from my phone to publish this quiz.

Audiences Feedback:

Audiences can rate my Quiz and give a feedback. It’s a two way communication.

Search can  be done,

You can search by area as well.

Week 5 LOCATIVE NARRATION IN DIGITAL CITIES

The notion of the public space will be associated with the dream like experiences of a city structure. In this context Berry has also stated that the presence of the different media platforms will be characterized by a transformation of the domain of public into the phase of publicness. The locative factor in the digital media is associated with the different mediums of time and space for the visual media like the television or the photography media.

Ritche in his analysis of the locative factor sin the digital media has proposed this analysis for the purpose of the establishment of the distance between the various ends visible in the Oxford Street. The bound was also created on the various computerized media. The bounds have also instructed that the user of this type of media in order to take the pictures of the underground station (Headrick 2-017).

According to Ritchie in the year 2014, there were several mobile forms of the locative nature of the narrative that will be navigated into the different spaces. The two spaces will be physical and the digital media forms. This principle will also apply to the various action bound apps because the various users will be compelled to accomplish the said mission. One of the main constraints that Ritchie has elaborated is the process of the possible inaccuracy that will occur if the user is bound to the various time bound manner when the users will be asked to form an effective evaluation of the time period to walk from the two ends of a single street.

In this context the various public space domains, the public space will be heavily dependent on the digital space perspective that will make users unable to accomplish the bounds. The locative networks will be based on the different technologies of the digital media that will turn into a relatively new phenomenon. The locative aspect of the digital media will also transform the +site-specific notions along with the other practices ((Sheller 2016).


References


Headrick Taylor, K., 2017. Learning along lines: Locative literacies for reading and writing the city. Journal of the Learning Sciences, 26(4), pp.533-574.

Sheller, M., 2016. Mobile mediality: Location, dislocation, augmentation. In New mobilities regimes in art and social sciences (pp. 335-352). Routledge.