Week 8: Digital Urban Gaming (Miriam Harvey)

This week’s topic is mobile phone games, but in this blog post the usual case study of Pokemon Go has been replaced. At the time of writing this, in England, bumping into people in the street while being distracted playing Pokemon Go would be highly inappropriate. However our mobile phones are playing along in a huge collaborative endeavour. They are providing location-data which we see displayed, as a population, in televised government briefings (Figure 1) in a way that feels like a game score board. The rules of the game are to be seen (digitally, by providing location-data) in the right location ie residential is good and transit stations bad.

Mobility slide showing Google Mobility Data (UK)

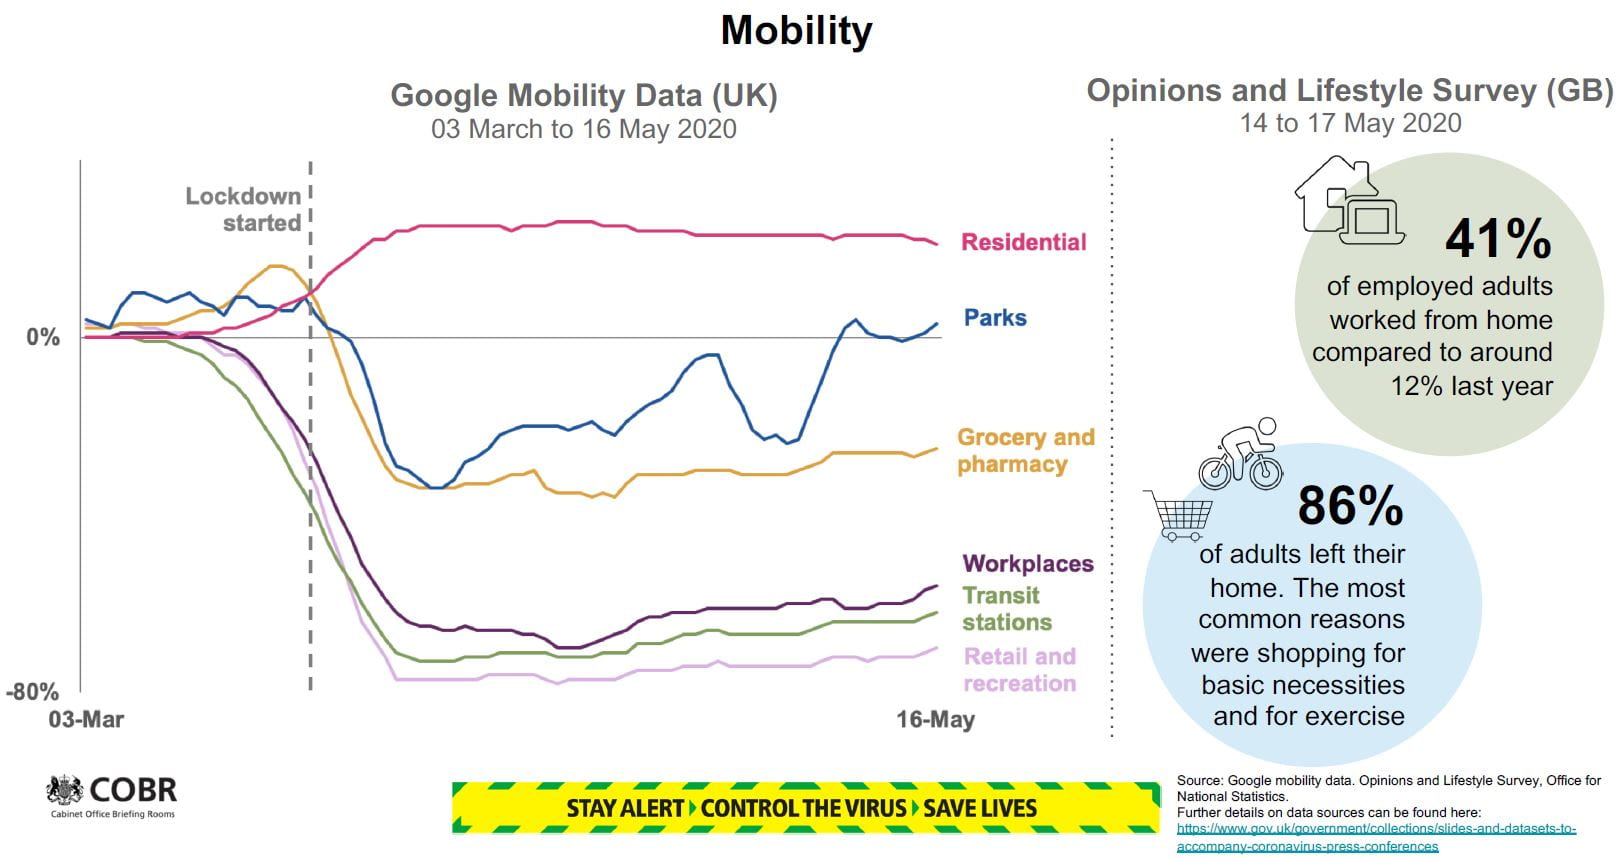
Figure 1: Mobility slide for UK Government briefing on 23 May 2020 (Gov.UK, 2020). Source: https://www.gov.uk/government/collections/slides-and-datasets-to-accompany-coronavirus-press-conferences


The next step in the gamification of daily life is to move from population level surveillance to player level, through a contact-tracing app. Schechner and Strasburg (2020) provide a good explanation of current international debates on some governments’ centralised vs Google/Apple’s decentralised approaches, with the Bluetooth and location services options illustrated in a video-game style animation (Figure 2).

Joanna Stern video on Covid19 contract tracing app as a game 20/05/20

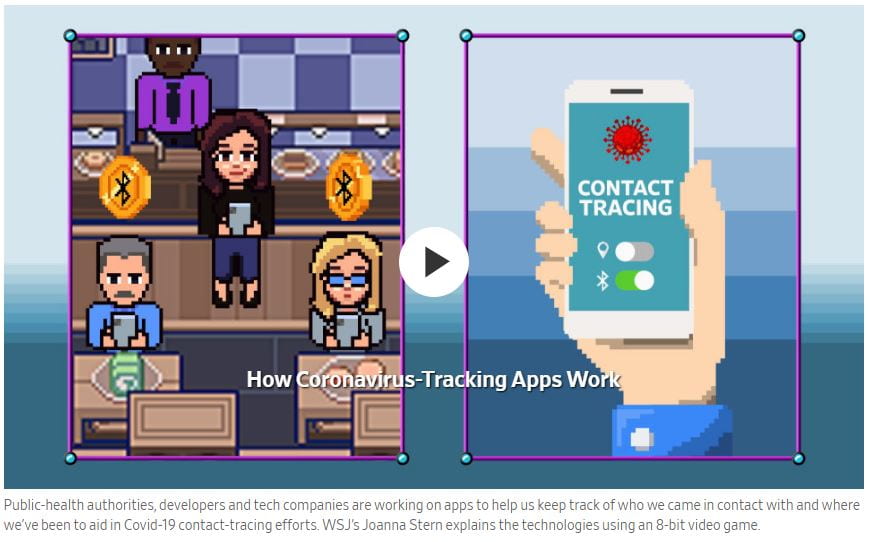
Figure 2: Tracking apps explained using video game style animation (Schechner and Strasburg, 2020). Source: https://www.wsj.com/articles/apple-google-start-to-win-over-europe-to-their-virus-tracking-technology-11589716800


Contact-tracing apps are based on mobile phones exchanging a key or token with other mobile phones within a certain proximity to each other. This transfer could be understood as a “co-surveillance mechanism” which de souza e Silva and Sutko (2009:15) refer to in the context of “mobile location-aware games” (Ibid, p2). The contact-tracing apps fits their definition of such games (pp. 3-4) as “(1) they use the city space as the game board, and (2) they use mobile devices as interfaces for game play”. They are “pervasive games” that “never stop and may intertwine with the player’s ordinary life”. They are a form of “Location-based mobile games (LBMGs)” whose “distinct characteristic […] is that they use mobile technologies with location awareness […] as the game interface”.

The question to end on is what is the role of the human player? The mobile devices are communicating with each other, but they need to be carried by their human users as they move through the urban space. The game’s purpose is to warn players when they may have been infected, and therefore need to isolate to break the virus’ chain of transmission. The reward for participating could be understood using Foth et al’s (2016:15-16) idea of “citizens at play” and their “civic capital” which they define as “a measure of a citizen’s actual and potential impact on contributing, participating and engaging in the civic surrounds”.

Contact-tracing app users are ‘citizens at play’.


References

Foth, M., Hudson-Smith, A., and Gifford, D. (2016). Smart cities, social capital, and citizens at play: A critique and a way forward. In Olleros, F. X. & Zhegu, M. (Eds.) Research Handbook on Digital Transformations. Edward Elgar Publishing, Cheltenham, United Kingdom, pp. 203-221.

Gov.UK (2020). Slides, datasets and transcripts to accompany coronavirus press conferences. Coronavirus (COVID-19) | Guidance and support. Available at https://www.gov.uk/government/collections/slides-and-datasets-to-accompany-coronavirus-press-conferences

Schechner, S. and Strasburg. J. (2020). Apple, Google Start to Win Over Europe to Their Virus-Tracking Technology. Wall Street Journal (Online); New York, N.Y. Updated 20 May 2020. Available at https://www.wsj.com/articles/apple-google-start-to-win-over-europe-to-their-virus-tracking-technology-11589716800

de Souza e Silva, A. and Sutko, D. M. (2009). Digital cityscapes: merging digital and urban playspaces. Peter Lang Publishing, Inc., New York. pp. 1-17.


Week 10: Sustainability, Mobility and Utopia (Miriam Harvey)

Elliot and Urry (2010) start their book ‘Mobile Lives’ by defining a broad scope for mobility as an “ever-increasing movement of people, things, capital, information and ideas around the globe”. They state that “the argument of the book is that … the increasing mobilization of the world … affects the ways in which lives are lived, experienced and understood” (ix-xi).

Elliot and Urry look at the “complex interplay between mobile lives and mobility systems”. Mobility systems are defined as being “from the car system to air travel, from networked computers to mobile phones”. Of particular interest (to me) is how these systems change people’s lives. Elliot and Urry observe that:

“Life ‘on the move’ is the kind of life in which the capacity to be ‘elsewhere’ at a different time from others is central. … Such mobile lives demand flexibility, adaptability, reflexivity — to be ready for the unexpected, to embrace novelty”.

Ten years after Elliot and Urry published their book, the world is experiencing the Covid-19 pandemic. In early April 2020 it was reported that “half of the world’s population” were subject to “compulsory or recommended confinements, curfews and quarantines in more than 90 countries or territories” (Sandford, 2020). Elliot and Urry’s future scenarios, such as a “a worldwide reconfiguration of economy and society around ‘local sustain-ability’ (2010:142) no longer appears as extreme and improbable as it would have pre-Covid-19.

Local sustainability (Elliot and Urry, 2010: 142-147) is presented as a Utopian vision, with a “’Happy Planet Index’”, but it presumes that there is only a physical existence and no other forms of communication. The ‘digital network’ scenario (Ibid. 147-150) is an alternative but not considered as complementing ‘local sustainability’. In current times, the size (distance) of individual’s physical circle has contracted at the same time as an increase in mobility via digital communication devices and platforms. For example, MPs are now participating from home in Parliament (figure 1) or Cabinet (figure 2) sessions, and in this way they have demonstrated new combinations of physical and network mobility.

UK Gov virtual PMQ session

Figure 1: BBC image of UK Parliament’s PMQ session operating with MPs participating via screens. Source: ‘Prime Minister’s Questions goes ‘virtual’’ on 22 April 2020 https://www.bbc.co.uk/news/av/uk-politics-52390054/coronavirus-prime-minister-s-questions-goes-virtual [accessed 2 May 2020]


Tweet by PM Boris Johnson on digital Cabinet

Figure 2: Tweet by UK Prime Minister Boris Johnson about the first digital Cabinet meeting (31 March 2020). Source: https://twitter.com/borisjohnson/status/1244985949534199808 [accessed 2 May 2020]


MPs are obviously not the only people working from home, with the Office of National Statistics (ONS, 2020) reporting an increase of home working from 12% to 49% for adults in employment. If this number is reflected across the country, there will be a lot of people questioning why they need to return to time consuming, expensive and polluting commutes post-Covid-19, if they can work just as well (or better) from home. Some aspects of Elliot and Urry’s ‘local sustainability’ scenario may yet become a possible future.


References

Elliot, A., & Urry, J. (2010). Mobile Lives. Oxford: Routledge

ONS (2020) quoted in UK Government briefing 1 May 2020. Available from https://assets.publishing.service.gov.uk/government/uploads/system/uploads/attachment_data/file/882862/2020-05-01_COVID-19_Press_Conference_Slides.pdf

Sandford, A. (2020). Coronavirus: Half of humanity now on lockdown as 90 countries call for confinement. Euronews. 3 April. Available at https://www.euronews.com/2020/04/02/coronavirus-in-europe-spain-s-death-toll-hits-10-000-after-record-950-new-deaths-in-24-hou [accessed 2 May 2020]


Week 9 – Drones (Miriam Harvey)

When the MJM20 course leaders designed this course, and posed questions for Week 9’s drone topic such as “Have you seen video footage from a drone? Why are drones so popular as present?” (Sourbati, 2019) it is unlikely that the use of drones to fight Covid-19 was anticipated. Drones have recently been used by police forces in a number of countries to enforce the new social distancing and isolation rules.

My case study for this week is Derbyshire Police’s (2020) Twitter post which included an annotated drone footage of unwanted visitors to the Peak District, during a public health lockdown period (see figure 1). This Twitter post was widely reported by news media (eg BBC, 2020; Pidd and Dodd, 2020; ITV, 2020). The remote location of the Peak District should be noted in this case because while surveillance cameras are standard fixtures in urban spaces, they have not previously been associated with the open countryside. A point for consideration is whether the drone, as used by Derbyshire Police, extended the boundaries of the digital city.

Twitter post by Derbyshire Police

Figure 1: @DerbysPolice Twitter post, 26 March 2020 [screenshot taken 28 March 2020]
https://twitter.com/DerbysPolice/status/1243168931503882241?s=20

Jensen (2016:71-72) proposes that there are six dimensions of surveillance, two of which are illustrated in this case study. Jensen’s first dimension is “Copresent humans” where humans watch humans, with the example given being police officers watching citizens. In the Derbyshire Police example, the drone is operated by police officers and the citizens being filmed by the drone would probably have been aware of a drone flying near them. However the viewing position would not have been “from the same vertical position”, as the drone footage clearly shows the camera angle looking down on the people and their cars. The position of the drone above the people is a position of power for the drone.

Jensen’s (2016:72) fifth dimension “Drone surveillance” highlights that drones “represent a mobile tracking and surveillance scenario, creating a very versatile and situational flexible surveillance system”. As noted above, this versatility extended the reach of police activity outside of what might have been considered the boundaries of the city. In his conclusion, Jensen (2016:73) poses some pertinent questions:

“What happens with our cities if the fifth dimension of surveillance becomes institutionalised as a standard operation procedure of surveillance? Seen from the point of view of the state apparatus, this means new and unseen potential for crowd control and surveillance. Seen from the point of view of the citizen, this means the end of public space as we know it.”

The question that I think was missing in Jensen’s paper was about the use of the drone surveillance footage after it was captured. Jensen focuses on the scene when the drone is operated, but as demonstrated by the Derbyshire Police Twitter post, the sharing and resharing of the annotated video succeeded in reaching a much wider audience and challenged the notion of public spaces and the perceived freedoms in such spaces.


References

BBC (2020). Coronavirus: Peak District drone police criticised for ‘lockdown shaming’. BBC, 27 March. Retrieved from https://www.bbc.co.uk/news/uk-england-derbyshire-52055201

Derbyshire Police (2020) @DerbysPolice Twitter post 26 March. Retrieved from: https://twitter.com/DerbysPolice/status/1243168931503882241?s=20 [accessed 28 March 2020]

ITV (2020). Derbyshire Police post video shaming people for breaching lockdown rules. ITV, 26 March. Retrieved from https://www.itv.com/news/calendar/2020-03-26/derbyshire-police-post-video-shaming-people-for-breaching-lockdown-rules/

Jensen, O.B., (2016) Drone city – power, design and aerial mobility in the age of “smart cities.” Geographica Helvetica, 71(67–75), pp.66–75, Denmark

Pidd, H. and Dodd, V. (2020). UK police use drones and roadblocks to enforce lockdown. Guardian, 26 March. Retrieved from https://www.theguardian.com/world/2020/mar/26/uk-police-use-drones-and-roadblocks-to-enforce-lockdown

Sourbati, M. (2019). ‘MJM20 Digital Cities Module Handbook – 2019/20’, University of Brighton School of Media, Brighton

Week 6 – City Dashboards & Open Data (Miriam Harvey)

This week’s topic explores how cities use ‘dashboards’ to collect, analyse and display data in various ways.

Kitchen et al (2015: 6-7) set the scene:

“Since the early 20th century, social and economic indicators, such as unemployment rate [and] inflation […] have been used by governments to assess how a nation is performing (Godin, 2003). Likewise, in the post-Second World War era, many supranational agencies […]  measure, collate, and track the performance and productivity of various health, economic, and social phenomena across nations and regions.”

“Since the turn of the millennium, these indicator suites have been accompanied by numerous city benchmarking projects that compare and rank the relative performance of cities against one another. […] Whilst many urban indicator and benchmarking projects are relatively closed in nature […] there has been a recent move to open up the data underpinning indicators and share them with citizens through online, interactive data visualizations, often termed ‘city dashboards’”.

An example of such a dashboard can be viewed at https://data.london.gov.uk/ which describes itself as “a free and open data-sharing portal where anyone can access data relating to the capital” (London Datastore, n.d.). Figure 1 shows examples from the health section of this website, where data has been selected to support the Greater London Authority (GLA)’s promotion of London as a healthy place to live.

These graphs show a trend of life expectancy at birth being increasingly higher in London compared to England and Wales, and mortality rates declining and lower in London compared to England. It should be noted that data for Wales is only included for the life expectancy at birth comparison, even though mortality rates for England and Wales are publicly available from the Office of National Statistics. This raises the question of whether the GLA are distorting the image of London by excluding the Welsh mortality rates, to support their narrative.

An increase in childhood obesity is highlighted in the text about health, and the graph displays the data in an exaggerated way to imply that it is much higher in London compared to England. The scale used in different graphs are inconsistent. It may be highlighted to support a decision to prioritise work and funding for this issue. The tooth extraction for children graph lacks meaning as it has no comparison to other geographical locations or historic records, although it could be seen as being linked to childhood obesity if it is caused by an unhealthy diet. Kitchin et al (2015:14) note that “some municipalities use indicator and benchmarking initiatives to underpin forms of new managerialism, wherein they are used to guide operational practices with respect to specified targets and to provide evidence of the success or failure of schemes”.

Screenshot of health data from London Datastore

Figure 1: Screenshot of some of the health data graphs displayed on https://data.london.gov.uk/

The data used by the GLA is selective, and the way it is displayed is inconsistent. According to Kitchin et al (2015:18), the “indicator, benchmarking and dashboard initiatives […] do not simply act as a camera reflecting the world as it is, but rather act as an engine shaping the world in diverse ways”. This dashboard demonstrates an attempt to influence people’s perceptions of London. By presenting the dashboards as factual evidence, the GLA is using data to give credibility to their claim that London is well governed and successful.


References

Kitchin, R., Lauriault, T.P. & McArdle, G., (2015). Knowing and governing cities through urban indicators, city benchmarking and real-time dashboards. Regional Studies, Regional Science, 2(1), pp.6–28.

London Datastore (n.d.), Greater London Authority (GLA). Available at https://data.london.gov.uk/


Week 5 – Locative Narrative + Actionbound (Miriam Harvey)

“spaces we move through are media that tell stories” (Ritchie, 2013)

Ritchie (2014:53) describes “transmedia” stories [which] “blur the line between storyworld and physical world, requiring that authors tell stories across a variety of media, including architectural space and the physical environment.” My case study this week is an actionbound I have built on a web browser and played on a mobile phone to gain first hand experience of designing and using media that can “blur the line between storyworld and physical world”.

My actionbound topic is a dog walk, because it is a daily activity which does not obviously or intrusively involve technology. The walks are a simple physical exercise, so I was interested to see how the actionbound I designed could add a new dimension of “navigating across digital and physical spaces” (Ritchie, 2014: 65).

Ritchie (2014: 55) explains that “design choices and materials of everyday things afford and constrain the behaviors of users”. In this case study, the affordance I experienced from playing the bound was the gamification. An uneventful walk through quiet streets and empty parkways became a game, and therefore more interesting. There was though an effort required to play the game, which Ritchie (2014: 57-56) describes as “”nontrivial effort””. He warns that “the narrative must offer a reward perceived to be greater than the effort required by the audience” and I don’t think my simple actionbound achieved that.

My actionbound started with an ‘information’ screen to introduce the bound and a ‘mission’ to ‘evidence’ that the player was ready for the dog walk by uploading a photograph taken on the phone’s camera of poo bags and a dog lead. It included a ‘find spot’ [figure 1] using the phone’s ability to use GPS and a map displayed in the app; a second ‘mission’ to find a specific location based on text description and a photograph [figure 2] and upload a similar photograph. There was also a ‘scan code’ [figure 3] to ‘evidence’ that a poo bin was reached in the trail. It concluded with a ‘quiz’ to gauge the time taken to complete the dog walk. The results can be seen in Figure 4.


The experience of playing the bound made me aware of the two distinct worlds of the digital space and physical space. For most of the walk, the digital space was a passive overlay on the physical environment. The “digital bridges” (Ritchie: 2014: 63-64) of finding a spot through GPS and map or text description and photograph, and scanning QR code were active elements that made the story more engaging as a user and demonstrated the “co-authoring” (Ritchie: 2014: 65) aspect of transmedia storytelling.

The actionbound was played in public areas – public roads and public parks, maintained by the local town authorities. I felt like I was appropriating public space for private use when playing the game because I was using the space in a manner that is different to the way I expect it is intended. Adding a QR code to a poo bin was the strongest appropriation because I was making a (temporary) physical change to public property. Berry et al (2013:3-5) points out that there are many ways to understand the term “public” and “[t]he traditional idea of space … has become fundamentally problematized by the presence of media distributing and redirecting data flows that transverse the boundaries of an enclosure”.  Therefore, what I perceived as a private use of a public space could instead be understood as a creation of a new dimension of a public space; the production of a “heterogeneous space” that is “comprised of diverse things and qualities”.


References

Berry, C., Harbord, J. & Moore, R.O., (2013). Public space, media space, Basingstoke: Palgrave Macmillan

Ritchie, J. (2013). Ch. 4: Wayfinding on Campus, The mobile story. Available from: http://themobilestory.com/ch-4-wayfinding-on-campus/

Ritchie, J. (2014). The Affordances and Contraints of Mobile Locative Narratives. In The Mo- bile Story. Narrative Practices with Locative Technologies, ed. J. Farman, 53–67. Oxon: Routledge.


Week 4 – Code/Space (Miriam Harvey)

Kitchin and Dodge (2011:20) describe their book Code/Space as being “about the relationship of software, space, and society”. The case study I chose this week (from http://www.scoop.it/t/the-programmable-city) is an article in Wired magazine about smart cars needing smart streets (Luke Dormehl, 2016) to communicate with and respond to each other to help their users. It is an example of code/space because Dormehl demonstrates in his article the relationship between cars, city and users.

Dormehl quotes Anthony Townsend to explain why traffic management is a problem that needs solving. Townsend describes the street as “a very complicated version of musical chairs”; a “scarce, expensive piece of land and resource” where “the more you co-ordinate it, the more benefits you can get.” He continues by pointing out that “30 per cent of traffic in cities is caused by people driving around looking for parking”.

The solution to this problem might be coming from a winning entry to a Smart City Challenge organised by the US Department of Transport, implemented by Alphabet-owned Sidewalk Labs. It involves “the use of camera-equipped vehicles […]  to count the number of available parking spaces in the city, as well as reading relevant parking signs [aggregated] with data from Google Maps [to] help direct drivers to empty spaces”. In this vision of the future, the code will be doing their “double duty” (Kitchin and Dodge, 2011:26) communicating in a machine-to-machine language between car and city, as well as in “an understandable notation for humans” such as a sat-nav image or an audio message in English to let the human car user know where to park their car.

Continuing on the theme of car/city communications, Dormehl refers to a recent data-sharing agreement between traffic app Waze and the city of Boston. The data that the city wanted from Waze is collected by the Waze app on car users’ mobile phones. This data is quietly collected through software that runs code to instruct the phone to collect GPS coordinates, calculate the speed and distance travelled, and capture use feedback. Kitchin and Dodge (2011:4) note that “although code in general is hidden, invisible inside the machine, it produces visible and tangible effect in the world”.

The ‘visible and tangible effects’ for Waze users is information that enables them to avoid traffic problems. The agreement between Waze and the city enhanced this service. Dormehl reports that “[i]n exchange for advance notice from city authorities about planned road closures, Waze agreed to share data gathered from its users with Boston’s traffic management centre”. The data collected from Waze users’ phones now had a wider, more long-term benefit as “this data exchange will help Boston to fine-tune its traffic light timings and urban planning.”

These two examples illustrate the point made by Kitchin and Dodge (2011:42) about the technicity of code where “software acts autonomously, and at various points in the process is able to automatically process inputs and to react accordingly”. However, they note that “technicity of code is not deterministic […] Rather, technicity is contingent, negotiated, and nuanced; realized through its practice by people in relation to historical and geographical context.” The software in smart cars and smart cities needs the human users to give it purpose. As illustrated in this artist’s impression from the 1950s of a future world with self-driving cars, the car journey is determined by humans while the car and the road work together to execute their pre-coded instructions.

1950s depiction of driverless cars

“A 1950s illustration depicting a utopian world of driverless cars. Photograph: GraphicaArtis/Getty Images”
Source: https://www.theguardian.com/technology/2019/oct/03/collision-course-pedestrian-deaths-rising-driverless-cars

The case study shows that there are new relationships emerging between public streets and the people, cars, technology services and city planners. Berry et al (2013:1) note a tension around the ownership of public spaces, stating that it “is almost by defini-tion contested, or at least negotiated, space in that no one person or company can unequivocally own and control it.” Maybe the notion of ‘pubic’ and ‘private’ should be reconsidered, as a smart city requires interdependence, and data to be collected, shared and used in a way that blurs the old boundaries between public and private.


References

Berry, C., Harbord, J. & Moore, R.O., 2013. Public space, media space, Basingstoke: Palgrave Macmillan

Dormehl, L. (2016). ‘The road to tomorrow: streets need to be as smart as the cars driving on them’. Wired. 7 November. Available from: https://www.wired.co.uk/article/smart-cars-need-smart-streets

Kitchin, R. & Dodge, M., (2011). Code/space software and everyday life, Cambridge, Mass.: MIT Press


Week 3 – Data and the smart city (Miriam Harvey)

Mosco (2019, ch 2) identifies a number of perspectives and aspects of digital smart cities, including technology, citizens, space-time, computer and platform. I would like to start by looking at platforms, which Mosco explains as follows:

“Materially, platforms are defined spaces with starting points and directions to get from those points to others within the platform. […] Platforms are not limited to cyberspace. They can also occupy material spaces and the city is a likely candidate for the term because it occupies a defined space that provides a starting point (your home, your workplace, your hotel) and markers that take people wherever they need to go in the city. […] It suggests that the city is not just a thing but is also a process” (p35).

Mosco’s description above implies that getting for one point to another is the key activity, but this should be interpreted more broadly and he continues with an introduction to the concept of the city as a service. He quotes Woods (2018) on this topic:

“The idea of the smart city platform encompasses both the technical aspects of the platform concept and an emerging vision of the city as a service, enabling an innovative ecosystem of urban service providers from a diversity of industries.”

I will explore this idea of the smart city platform and the city as a service, plus I will add later Mosco’s perspective of space-time, using my case study. The case study I have chosen is a platform in cyberspace utilising physical spaces in cities, with a peer to peer model that appears to by-pass government controls. My case study is Airbnb, which describes itself as an “economic empowerment engine [helping] millions of hospitality entrepreneurs monetize their spaces and their passions while keeping the financial benefits of tourism in their own communities” (Airbnb, n.d.)

In a Wired article, Temperton (2020) exposed a scam on Airbnb operating in London. The scam includes thousands of fake reviews, which consumers have to rely on to know whether to trust the Airbnb ‘hosts’. These reviews were for properties built with planning permission specifically for residential units (not short-term rentals). Temperton also shows how powerless or unwilling the government authorities were to enforce regulations that should have protected the interests of the local residents, who needed homes and not an Airbnb de facto hotel.

Temperton explains the challenges faced by regulators who do not have the data they need to do their job, quoting an unnamed academic as saying  “It’s the data that you need to govern the city, to regulate, to do urban planning. And Airbnb refuses to give this data, which makes it impossible for policymakers to effectively measure and monitor the phenomenon, let alone regulate it.” The data they need is a register of short-term rentals, to be able to protect the availability of residential housing stock.

Authorities need Airbnb to give them the data, as opposed to them collecting it themselves, because Airbnb has blurred the visible line between residential and commercial properties. They have successfully used another one of the smart city aspects identified by Mosco (2019:32-33), which is “the vision of smart cities as ‘space-time’ machines [where] Smart city technologies increase the elasticity and hence the value of space and time”. This elasticity is blurring boundaries, but a website that is trying to provide a clearer picture is Inside Airbnb (see screenshot).

screenshot of Airbnb data in LondonScreenshot from Inside Airbnb which “analyzi[es] publicly available information about a city’s Airbnb’s listings, […] so you can see how Airbnb is being used to compete with the residential housing market”. (Inside Airbnb, n.d.)

I conclude by asking what the biggest challenge would be if a government did try to regulate and control Airbnb.  Morozov and Bria (2018:17) argue that Airbnb has “immense power to mobilize users via their own apps and emails [which] means they can rally support against regulation relatively quickly.” They also claim that Airbnb is “organizing its fans into a worldwide movement with an explicit political agenda”. This sounds extreme, but there clearly is a power struggle between governments, big technology companies and the citizens when their interests are not aligned.


References

Airbnb (n.d.) About us. Available from https://news.airbnb.com/about-us/

Inside Airbnb (n.d.) About Inside Airbnb. Available from http://insideairbnb.com/about.html

Morozov, E. and Bria, F. (2018) RETHINKING THE SMART CITY Democratizing Urban Technology. Available from https://onlineopen.org/media/article/583/open_essay_2018_morozov_rethinking.pdf

Mosco, V. (2019) The Smart City in a Digital World. Emerald Publishing Limited. doi: 10.1108/9781787691353.

Temperton, J. (2020). ‘I stumbled across a huge Airbnb scam that’s taking over London’. Wired. 11 February. Available from https://www.wired.co.uk/article/airbnb-scam-london

Woods, E. (2018) cited in Mosco, V. (2019) The Smart City in a Digital World. Emerald Publishing Limited. doi: 10.1108/9781787691353. pp 35-36


Week 2 – Smart Cities and Digital Culture (Miriam Harvey)

Two smart city aspects discussed in the BBC Radio 4 Thinking Allowed Smart cities podcast (Taylor, 2018) were the responsiveness of smart cities to humans, and the role of humans in shaping smart cities.

Townsend (2013) argues that the growth of urbanization, which has seen an increased concentration of people in cities, combined with the growth of ubiquitous wirelessly networked sensing and communicating technology, has created an opportunity for dynamic smart cities that can respond and adapt to humans. His vision of smart cities has a new layer of infrastructure that “invisibly […] reacts to us” as they “adapt on the fly, by pulling readings from vast arrays of sensors, feeding that data into software that can see the big picture, and taking action” (Townsend, 2013: xiii).

These sensors and software are part of the digital aspect of smart cities. This digital, smart aspect can be understood using’s Miller’s (2011) analysis of new digital media. He identifies interactivity as a new element not found in old broadcast media. Interactivity is described as “the responsiveness of a media object or piece of information to the preferences, needs or activities of the user” (p16), which is the same responsiveness seen in Townsend’s description of smart cities.

The responsiveness of smart cities is discussed in Taylor’s (2018) podcast, where Taylor introduces the smart city discussion by playing a clip from an IBM technology video animation entitled ‘Living in the city’ [3:15 minutes in]. It describes how (non-smart) cities “require us to live on their terms, but in five years the tables will turn with cities adapting to our terms.” The IBM clip continues with an explanation that is nearly identical to Townsend’s: “Systems will connect billions of events in real time, to anticipate movement and react to human preferences, patterns and demand. […] As we speak to our cities, they will listen”.

The second smart city aspect is the role of the humans as part of an assemblage of citizens and technology in a smart city. Townsend writes about the power people have to shape their experiences in a smart city, and how important that is in order to combat big tech companies and government’s focus on efficient, centrally controlled dehumanized infrastructure. In the BBC podcast, Oliver Zanetti challenges the idea put forward by Taylor that smart cities need ‘smart citizens’ to use its smart technology and instead introduces “activist citizens” [8:20 minutes in] which he defines as “not just a person who buys something, a person who moves around in the ways you’re instructed to do by the world at large. You’re actually someone who’s intervening in the way something works, making it work differently”.

Taylor introduces an example which illustrates the points made by Townsend and Zanetti about the democratisation of smart cities, where people can use technology for their benefit. Taylor plays a clip from a BBC news bulletin, Intune 2018 [8:51 minutes in] reporting on how Barcelona residents took action on noise levels using low cost sensors that can measure noise.

“By putting sensors by windows and on balconies the families were able to prove the noise levels at night were […] far higher that the World Health Organisation’s recommendations. Armed with their data, the residents went to the council who agreed to make some changes.”

Miller (2011:12) quotes Poster who saw the new interactive ‘internet model’, the digital culture, as having “a more active and critical subject”. The Barcelona example above fits this description very well, where smart city tools are not only available but are used in a critical manner by ‘activist citizens’ who are no longer passive and accepting of their environment and the information broadcast to them, and furthermore they now expect to be heard.


References

Miller, V. (2011) Understanding Digital Culture. In: Miller, V. Key Elements of Digital Media. Sage. pp 12-21.

Taylor, L. (2018). ‘Smart Cities’ in Thinking Allowed podcast (released 25/7/2018). BBC Sounds. Available from: https://www.bbc.co.uk/sounds/play/b0bbr3zn

Townsend, A.M., 2013. Smart Cities, New York: W. W. Norton & Company. pp xi-18.


Week 1 – introduction (Miriam Harvey)

Hi

I’m a distance learning student, studying this MA very slowly over a period of three to four years (one course per semester). I work full time in Berkshire utilising my digital skills in different roles, adapting my skills to changing digital requirements in the workplace.

Beyond the day job, I am interested in digital culture from a number of perspectives including its impact on an ageing population. About ten years ago my mother-in-law fell in her sheltered home. It took her an hour to crawl across the room to pull a cord that alerted a call centre, who were then able to use a speaker system to talk to her while calling me and an ambulance. Obviously, I saw a lot wrong in that system. More recently my mother used her Apple Watch to call for help when she needed an ambulance. Without any delays, this was a clear improvement on my mother-in-law’s experience a decade ago.

I was pleased to find an example of smart city technology in one of this week’s list of readings and weblinks that I know would be helpful to older members of my family, which was Internet of Things (IoT) sensors on traffic lights to detect if someone needs more time to cross a road (Bates, 2019). However, from personal experience, I am becoming increasingly aware of an over optimistic trust in technology to keep people safe and healthy. I expect I’ll be writing more about that in the coming weeks.

Miriam


References

Bates, D. (2019). ‘How Smart Cities Can Make Seniors Independent?’ in Smart Cities Library (source Tantiv4 15 October 2019). Available from: https://www.smartcitieslibrary.com/how-smart-cities-can-make-seniors-independent/