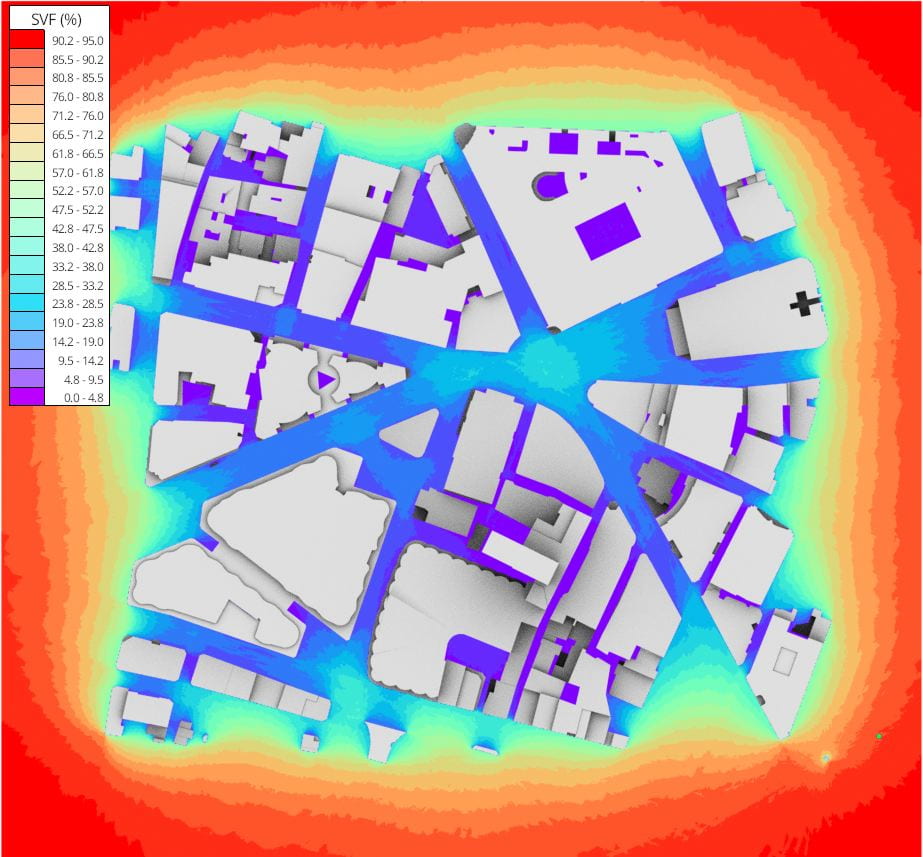
I’ve just uploaded a video that introduces the Sky View Factor (SVF) and shadow mapping capabilities of the VI-Suite.
The video also introduces the vi-suite-log file and how it can be used to provide data for some simple custom results processing.
As always I forgot some things in the video. The main thing is that coloured results geometry are placed in their own Blender collection called ‘LiVi Results’ although this video does not cover ‘LiVi’ analysis, but sky view and shadow are lighting related so I place these results within this collection. Once the VI-Suite has created this collection it is important to remember not to put your own geometry in it, as this geometry may then be ignored in subsequent analyses.
Results objects in this collection will be replaced every time a simulation is done, so if you want to keep this geometry for comparative analysis between scenarios move the object out of the ‘LiVi Results’ collection into the scene collection or your own collection.
I’ll also mention that clicking on the heat map analysis itself will bring up a matplotlib display window where you can set some options for the heat map and save that heatmap out to an image.
And finally, the ‘Results out’ sockets of the SVF and shadow mapping nodes can be connected to a VI Chart node for graphing, or the VI CSV node for outputting csv formatted results, but I will cover these two nodes in a separate video.
And finally, finally a github zip download from today or later is required to get the days reported in the VI-Suite log file.
And finally, finally, finally if in solid shading mode I suggest you choose ‘Flat’ shading, which can be found in the ‘Shading’ menu at the top right of the 3D viewport, for the best results visualisation.
I think that’s everything I’ve forgotten. Video is linked below.


Pingback: Blender for architecture: Sky View Factor and shadow mapping (VI-Suite) • Blender 3D Architect