“Taken together, coded objects, infrastructures, processes, and assemblages mediate, supplement, augment, monitor, regulate, facilitate, and ultimately produce collective life.”
Kitchin, R. & Dodge, M., Code/space software and everyday life, 2011
We are now far from a reality where software is understood as being something that exists only inside a computer. Instead, our modern lives are only possible because of the ubiquitousness of software – it is everywhere, all the time, from our laundry machines to our cell phones, from our video games to our navigation systems.
Nowadays, most of us cannot even drive around armed only with a paper map instead of a SatNav (Daily Mail, 21 January 2013). The ‘AI Takeover’ as fictionalised by Gibson, Ellison, and even consumer-media giants such as Marvel (Ultron) and the Terminator film series (Skynet) seem now closer to reality than fiction, and science giants such as Stephen Hawking and Elon Musk have even written in advice of creating precautionary measures to ensure this doesn’t happen.
HAL from 2001: A Space Odyssey is a perfect (albeit fictional) example of what Kitchin and Dodge describe as software exhibiting “some of the characteristics of being alive” and it being able to ““process information, evaluate situations, make decisions, and, most significant, act without human oversight or authorization”. We are increasingly handing over our decision power to software, not out of laziness but simply because we don’t know now not to.
But software, like us, has a body. Code occupies space in the form of hardware, and without these physical technologies the automated codes and processes we depend on on a daily basis – to receive our monthly salary or remind us of someone’s birthday – would simply not be there.
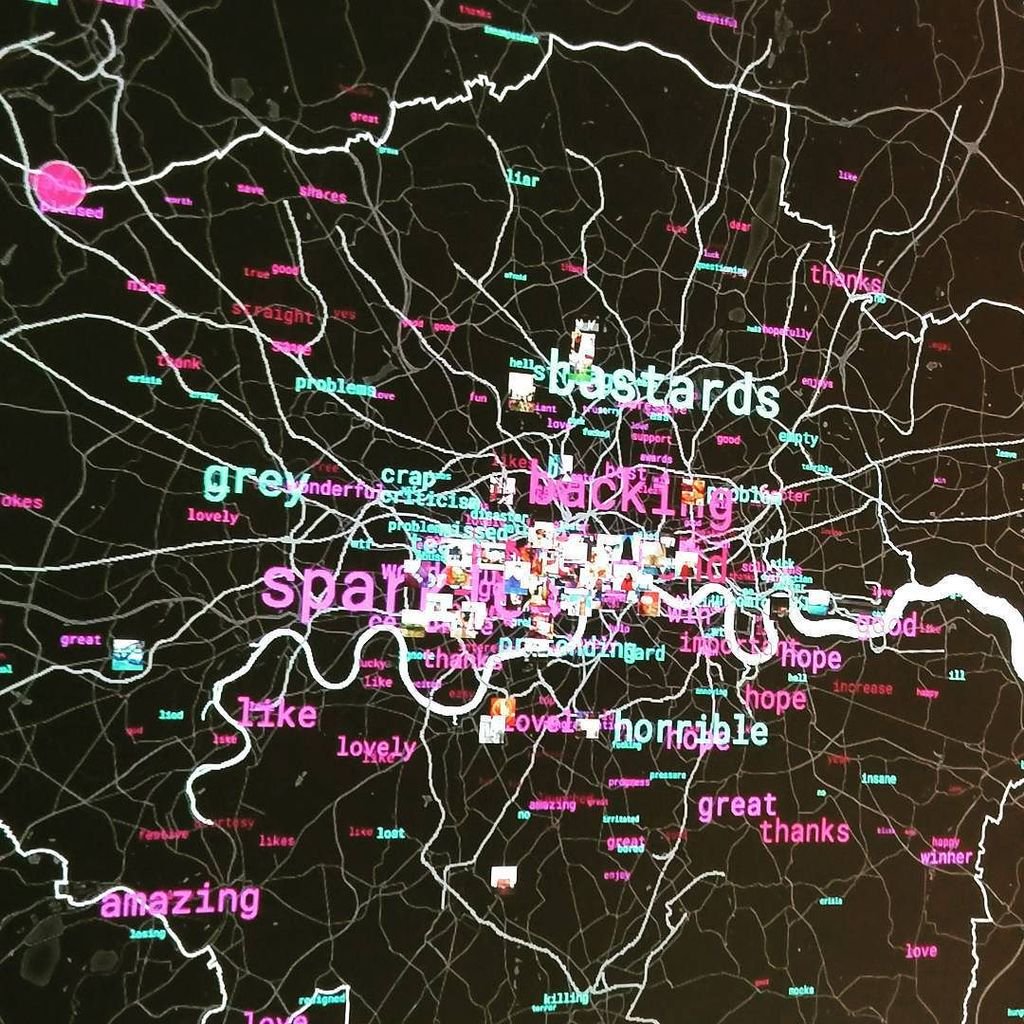
Ingrid Burrington and Dan Williams explored this particularly well in their Networks of London piece. The duo created a map – now available for download but present in the exhibition in the form of a cork board with post-its and pinned-down handwritten papers – of spatial representations and physical objects that serve as live, warm bodies for the codes that allow London to function. The question the authors pose is pertinent – “how do you see the Internet?” – and they attempt to answer it by circling and marking on a map objects such as CCTV cameras, antennae and utility cabinets. Without these objects, ‘networking’ and ‘connectivity’ cannot exist. This is made ever more noticeable by Timo Arnall’s Internet Machine, where one can truly experience (ironically through an audiovisual projection of the real thing) the physicality of code by standing in the centre of a living, breathing data storage and processing centre.
Without us fully realising it, our lives – from tweets to selfies, check-ins to bank accounts – are stored in those whirring, buzzing corridors and made available both to us and to our governments and big companies (such as Google or Facebook) via antennae, utility cabinets, wires and cables. We become code, through our purchases, phone calls, use of GoogleMaps and any questions we ask Siri. We become a commodity, something to be used, shared, sold to the highest bidder for marketing and indexing.
Where is the line between code and space? Where is the line between public and private, now that our sensitive information is in large invisible databases and not a paper folder? If there even is such a line, would we still be able to live our lives as we do now if our private because truly private again, and all the antennae in the world just stopped working?
Bibliography
Timo Arnall, Big Bang Data Artist Index
< http://bigbangdata.somersethouse.org.uk/artist/timo-arnall/index.html >
Networks of London, 8 January 2016
< http://bigbangdata.somersethouse.org.uk/networks-of-london/index.html >
Kitchin, R. & Dodge, M., Code/space software and everyday life, 2011, Cambridge, Mass.: MIT Press
Ward, A., Four out of five young drivers can’t read a map as we become more reliant on satnavs, 22 January 2013, Daily Mail [ Article ]
< http://www.dailymail.co.uk/news/article-2265917/Most-people-longer-navigate-map-reliant-satnavs.html >