If you’re like the thousands of ammeter marketers attempting to breach the digital barriers, you’ve probably looked at a myriad of conversion optimization techniques with the purpose of reeling in your audience. To save you the expense of filtering through the literature, this entry is designed to address the basics of Conversion Rate Optimization (CRO) and how you can convert even the most passive of visitors into active users.
In this series of blogs I will continue to focus on a range of digital marketing strategies, drawing on the auto industry as a touchstone for the selected case studies. Today’s topic for concern is Conversion Rate Optimisation and how companies could be using it to better some of their digital offerings.
Background
In 2014 the total number of websites exceeded 1 billion (Internet live stats, 2014), a milestone to which highlights the adoption of the world’s fastest growing media channel. This makes it ever more challenging for infant companies to articulate their offering as they wonder estranged into common CRO pitfalls. The solution is actually rather simple, and it starts with basic planning of key performance indicators (KPI’s) and realising the metrics in which you want to improve on.
However, before we get to that, let’s get started on a quick definition…
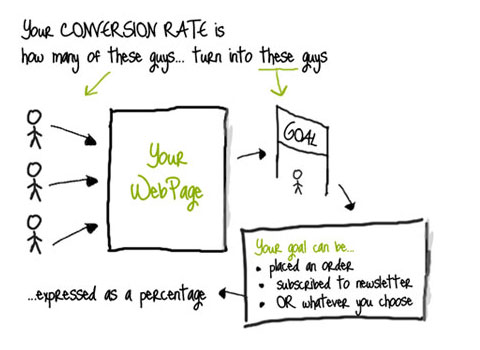
What is Conversion Rate Optimization?
“Conversion rate optimization (CRO) is the art and science of persuading your site visitors to take actions that benefit you, by making a purchase, offering a donation, or committing to some positive future action”. (King, 2008)
The definition provided by Andrew B. King personifies the basic notion and end-game in which CRO is designed to achieve. However, it’s the persuasive and design techniques in which will deliver an experience fit for its user.
Step #1: Data Gathering – Website, Audience & Goals
Before we delve into the nitty-gritty of CRO, the clever techniques and fundamentals of this concept, it’s important we initially address you and your company. Strategically what would you like to achieve? What are your goals and value propositions? Have you got a specific customer you’re currently having success with?
A basic strategic evaluation should be the bedrock of any proposed new strategy or initiative a company decides to pursue. As Johnson & Scholes (2008) suggests, it is very important to find the key drivers for change rather than overwhelming on all the details of the environment factors, as the key drivers may vary within industries. Before diving headfirst into the digital pool, you need to ask yourself; what are your core competencies and what are you capable of?
Goals
Establish Key Performance Indicators (KPI) – If you haven’t already, benchmark some goals and KPI’s. This could range from sales, marketing, financial, supply chain, social media and SEO goals depending on the nature of your business and its transactions. Here could be some existing examples:
- Sales projection on a month-by-month or annual basis
- In-store footfall
- Help Desk Inquiries
- Employee Turnover
- Inventory Turnover
- Newsletter Subscriptions
Website
What is your online sales process from start to finish? – Map out the exact process from CTA’s, emails and from a search engine – this is what’s known as conversion funnels. Ask yourself what common problems can users face and how you could possibly simplify the process. Step inside the shoes of your customer and take on their journey!
Analyse your traffic – By using basic analytics software such as Google Analytics, identify how much traffic your website or landing page receives, what demographics you typically attract and what technology they are using to access your website (e.g. desktop, mobile or tablet). This should develop a basic insight into who you’re dealing with and what you can do to foster their behaviour.
Audience
Engage with your audience – Interact with your customer, query them, and be the very eyes and ears of their concerns and desires. This requires basic conversation, customer surveys and by discovering how you can remedy their objections. To do this you could use the following online survey tools:
• Google Consumer Surveys
• Qualaroo
• Survey Monkey
• Qualtrics
• Usertesting.com
Step #2: List Hypothesis – Propose test(s) & Target Audience
Based on the data you have now gathered, its time you firmly underpin a hypothesis in which you’d like to test, the metrics which will measure its performance and what you’re likely to expect from your value offerings.
Firstly you should know that Conversion Rate Optimisation is not an exact science, nor is there a proven formula for success. Certain designs and techniques yield better results for different online initiatives (Weischedel & Huizingh, 2006). This hinges on a multitude of factors including the position of the brand, its audience and of course the nature of its value offerings.
Propose Test(s)
Honing in on your corporate objectives in step 1, you must now propose some digital KPIs. These will likely be the insights you discovered in the data gathering process which could ultimately improve the overall user experience. You will also be looking at areas in which are a specific interest to you strategically, whether that be the sales or checkout funnel, subscription conversions or even getting users to sign up to a donators list. Here could be a few realistic examples:
• Increase number of ‘unique visitors’ to the ‘offers’ webpage by 11%
• Increase number of ‘returning visitors’ to make repeat purchases by 15%
• Increase newsletter subscriptions by 10%
• Decrease website bounce rate by 26%
• Increase free download CTAs by 70%
• Increase Twitter followers to 1,000
• Increase email subscription list by 50%
• Decrease website exit rate by 20%
Of course, these will be dependant entirely on the nature of your value offering and the things in which you aim to achieve with your tests. It can be hard to determine a realistic estimate although your data gathering should provide an idea of the numbers which you aim to optimise.
Target Audience
At this stage you should already have a vague idea of who your target audience is, however, it’s important that you understand where the consumer is at in the buying cycle (Moz, 2014). Unless you’ve just launched your website, the likes are you’ll be focusing on both new and existing users, depending on your data you have gathered (see stage 1). Whatever your focus, you must remember that both groups of users are not mutually exclusive and for the purpose of the later stages, should be separated in your tests. Failing to do so could result in unreliable data since returning users will already have a working knowledge of how to navigate throughout the site.
Here could be a simple checklist for both types of user:
Returning User:
• Are their credit card details registered?
• Is their exit rate worth improving?
• Are they interacting with the FAQ’s?
• What browsers are they using and what journey do they take to get to the landing page?
• Are there any insights to be taken from geographic/location?
• What is the average age of your user?
• How much on average are they spending?
• Could you improve dwell times?
New User:
• Will they be accessing the website from multiple devices? (i.e. Desktop, Mobile or Tablet)
• Will they be accessing the website from an email, CTA, web browser or otherwise?
• Where will they be in the buying cycle? (awareness, consideration, intent, purchase)
• Will they have had prior knowledge of your brand?
• Will they have high (or low) spending power?
• Will they have already looked for your product elsewhere? (if product is homogenous)
Case Study #1: Toyota – Creating a Visual Experience
The Issue: As with any website providing high-involvement thinking products, it’s important that the website includes all the details and necessary specifications required to make a confident purchase decision. However, often this is not enough as Toyota realised prior to the release of their 2008 Highlander model.

Despite an extensive Q&A and product related information page, Toyota noticed a vast increase in the number of emails and calls coming in concerning this specific model.
The Change: In response to the sudden interest, Toyota introduced a flash movie presenting a guided tour of the car (King, 2008). This provided users with a virtual experience of what it’s like to step inside one of these vehicles rather than just reading a list of the cars key specs.
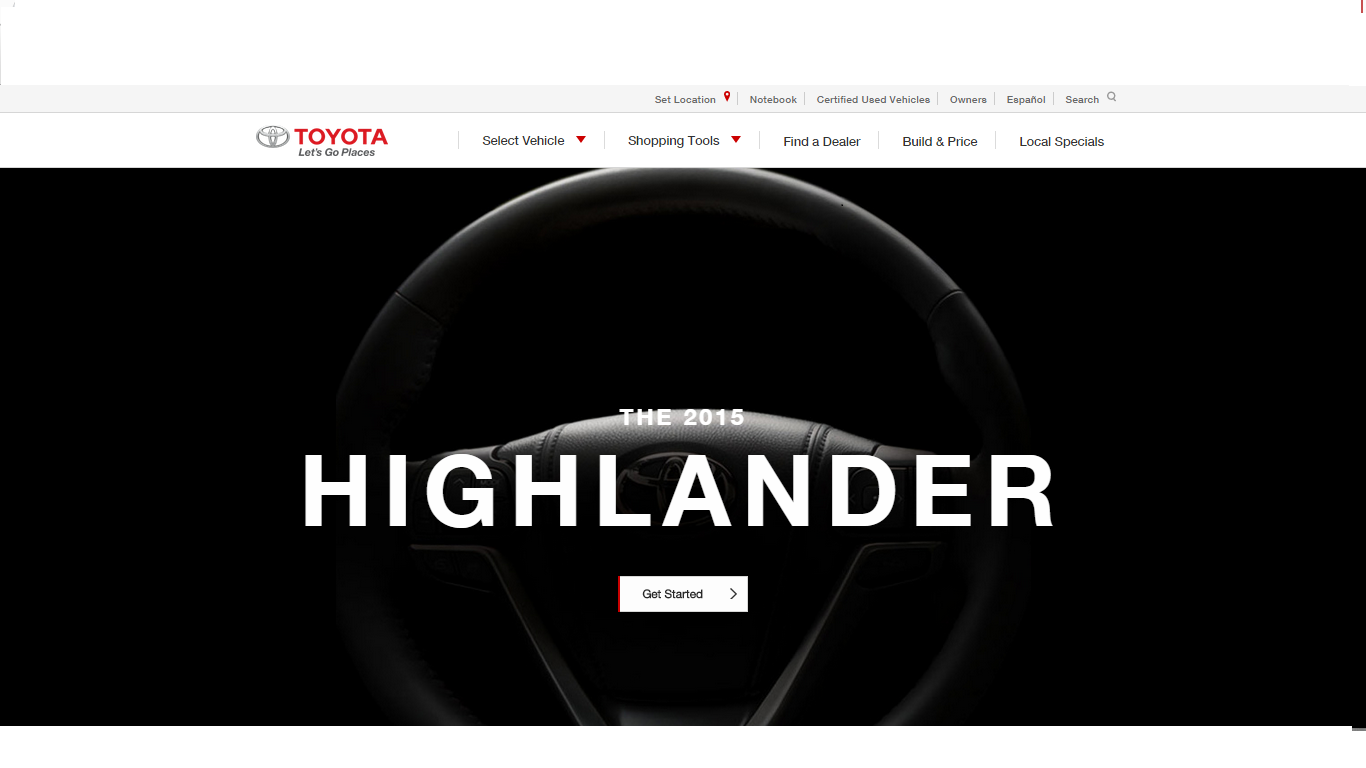
Online retailing is limited in the sense that it offers users with a visual component which is impalpable and thus impacts negatively on user acceptability (Ahn, Ryu & Han, 2007). Toyota however, found a near life-like experience of what it’s like to test their signature off-road vehicle with clever use of visualisation to give users what they want.
The Result: After adding the flash video, ‘test-drive’ conversions for the highly-anticipated Highlander rose by 62%, in addition to email subscriptions which inflated to almost 200%. Toyota’s efforts and focus on content as a means for CRO saw them replicate this process in their 2015 release of the model which remains a central to their online strategies.
Step #3: Experimentation & Testing – Wireframe designs, A/B Testing & Live Tracking
Now that you’ve decided on what it is you are testing, it’s time to put your hypothesis into action. But before moving on, just ask yourself: are the changes synonymous with the hypothesis? Are the changes technically doable? Are the changes in keeping with the brands identity? And are the changes reflective of my target audience?
All good? Right, now it’s time we test your hypotheses with some general wireframe testing.
Wireframe New Design
“Wireframes are the blueprint for all page layouts of the website. The wireframe comprises ugly boring plain boxes but what they represent is critically important”. (E-consultancy, 2013)
As Summarized above, wireframes are used to assist his or her buying journey with an open plan layout of what will be included on the site. Of course, this is all designed with the purpose of optimizing the best possible conversion rates and is imperative in the stage of any new website (or redesign) build. Let’s now take a look at the process of experimentation and testing your new designs.

A/B Testing
On the web you will come across hundreds of “top 10” lists claiming to improve your conversions – whether this be through simple word changes or by switching a green widget to a red one, the possibilities for upping your conversions are seemingly endless.

While all this may work for some, it’s not exactly guaranteed to work for you. The only way to be certain on your design is to test it, which is why A/B testing is so important in these later stages of the process.
What is A/B Testing?
A/B testing allows you to validate business ideas before fully deploying them (Go Digital Marketing, 2014). It is a simple way to test any of the changes you have made to your page up against your original design. This gives you the best opportunity to clarify what works with your users to help yield the best conversion rates.
So look at your proposed tests in step 3 – what key performance indicators do you want to increase (or decrease)? For example if you wanted to increase checkouts on your website, what design improvements could you make that fit the profile of your target audience? Are they new or returning customers? What design or featured elements of the wireframe are you changing and how is this meeting your hypothesis?
Live Tracking
It’s a requirement that at the very least you connect your site to analytical software such as Googles free Analytics service in order to track where your traffic comes from. A/B testing is the bread and butter of good CRO, and if you want to funnel your traffic accordingly, Optimizely’s visual editor will be a great place to start. Alternately you could use Unbounce or Analytics Content Experiments as your route into testing your ideas.
Let focus on another auto case study, and this time let’s look at Hyundai…
Case Study #2: Hyundai – Multivariate Testing
Ok, so it might not be traditional A/B testing, but it does showcase the efforts to test multiple ideas on a page which Hyundai did tremendously in their re-design of their landing pages for the Netherlands website.
The Issue: The primary goal was a brochure request and/or request for a test drive as requests for new vehicles were lacklustre (VWO, 2011). The second was to improve the click-through from the car page to the first step of the funnel since most of the traffic derived from paid advertising campaigns, with few users coming direct through SEO.
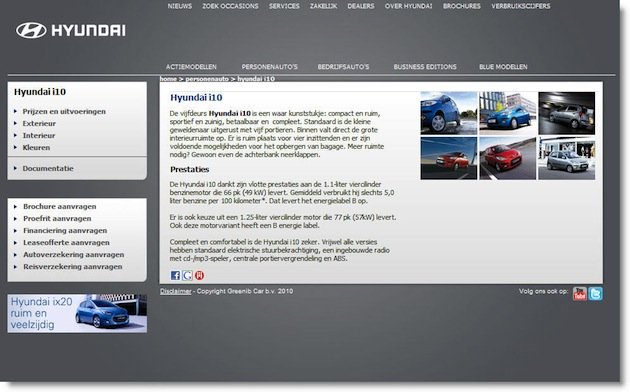
The Change: They decided that they wanted the make the website more user friendly by demonstrating visuals that replaced the current list of thumbnails. They also had the hypothesis that if they changed the normal control text to a better ‘SEO friendly’ text, they could permanently reap the SEO benefits (E-consultancy, 2011). Lastly they decided to measure the impact of a CTA button to encourage users to convert, since it was a technique they’d not yet used.

The Result: Hyundai were stunned by the outcome. Conversion rates for the test drive and brochure increased by 62%. The clickthrough rate noticed an incredible 208% increase and it’s really no surprise given the combination of these much needed changes to the landing page. As you can see the photos of the car give instant recognition that the user is on the correct webpage and as a result decreased the intention to exit. SEO friendly text only made the page easier to find for new users and the CTA illustrated desired action
Step #4: Review Hypothesis – Statistical Significance, Lessons Learnt & Evaluation
Statistical Significance
For many firms it the hardest challenge is knowing exactly how successful there hypothesis has been. Upturns in the business cycle can happen for a number of reasons making it difficult to underpin whether ideas have impacted. Some of the tools recommended in step 1 and 3 to help to address these problems by helping measure and track some of your changes.
Lessons Learnt
Conversion Rate Optimization is a trial and error process and there’s no shame if you don’t meet your expectations first time round. Take the opportunity to test everything that betters the user’s experience, instigating new customers and enticing returning users to buy, buy and buy again. Web 2.0 is in a constant cycle of evolution and it’s important that your company keeps finding ways of reinvigorating your digital narrative. Don’t however, fret too much over the idea of extensive A/B testing. While its importance can’t be overstated for large companies, for infant companies and SMEs it can sometimes be a timely and somewhat impractical proposition.
Lasting Thoughts
And there you have it, my 4 step method for successful Conversion Rate optimization. Hopefully you can take on-board with you a few lessons to implementing a successful design to your website that see your conversions sparkle instantly.
References
Ahn, T., Ryu, S. & Han, I., 2007. The impact of Web quality and playfulness on user acceptance of online retailing. Information & Management, Vol 44(Issue 3), pp. 263-275.
Dr. Weischedel, B. & Dr. Huizingh, E., 2006. Website Optimization with Web Metrics: A Case Study. Proceedings of the 8th international conference on Electronic commerce: The new e-commerce: innovations for conquering current barriers, obstacles and limitations to conducting successful business on the internet. ACM, pp. 463-470.
E-Consultancy, 2012. Eight user testing case studies that achieved amazing results. [Online]
Available at: https://econsultancy.com/blog/10922-eight-user-testing-case-studies-that-achieved-amazing-results/
[Accessed 5 April 2015].
E-consultancy, 2013. The power of wireframes and five ways they help digital strategy. [Online]
Available at: https://econsultancy.com/blog/63824-the-power-of-wireframes-and-five-ways-they-help-digital-strategy/
[Accessed 4 April 2015].
Go Digital, 2014. Why You Should Always Have a Plan B — The Importance of A/B Testing. [Online]
Available at: http://www.godigitalmarketing.com/plan-importance-ab-testing/
[Accessed 5 April 2015].
internet live stats, 2015. Total number of Websites. [Online]
Available at: http://www.internetlivestats.com/total-number-of-websites/
[Accessed 3 March 2015].
Johnson, G., Scholes, K. & Whittington, R., 2008. Exploring Corporate Strategy. 7th ed. London: Prentice Hall Financial Times.
King, A. B., 2008. Website Optimization. 1st ed. California: O’Reilly Media.
The Moz Blog, 2014. A 5-Step Framework for Conversion Rate Optimization. [Online]
Available at: http://moz.com/blog/5-step-framework-for-conversion-rate-optimization
[Accessed 4 April 2015].
VWO, 2011. How Hyundai increased requests for test drive by 62% using multivariate testing. [Online]
Available at: https://vwo.com/blog/multivariate-testing-case-study/
[Accessed 5 April 2015].