
The Open Data Institute defines open data as “data that anyone can access, use or share” (Open Data Institute, 2017) and believes it benefits citizens and economies. Open data is used on Community Insight, funded by Brighton and Hove City Council, allowing people to “find, explore and use a wide range of facts and figures at different geographic levels for Brighton and Hove.” (Community Insight, 2017). Similarly used on City Dashboard, which claims to “aggregates simple spatial data for cities around the UK and displays the data on a dashboard and a map.” (City Dashboard, 2017). The information on both these websites is about citizens and economies and free to access and they use dashboards to collect, analyse and display data.
Few defines dashboards as important information displayed visually on a single screen. (Few, 2006: 34). Leszczynski describes urban big data, such as displayed on the above websites, as “continuous, real-time flows of information,” and identifies a link in this and digitalisation. (Leszczynski, 2016: 1694).
At first look, city dashboards on these two websites appear to be representing a city. However, Kitchin et al describe city dashboards as actively framing and producing cities rather than reflecting them. (Kitchin et al, 2015: 6). This can be applied to Community Insight who provide statistics on areas of the city, rating them with the amount of child poverty, retired adults or people on unemployment benefit etc. This information could have a detrimental effect on an area by producing stereotypes. For example, more affluent people choosing to move to a different area to avoid what they could view as a higher percentages of undesirable qualities. However, they could also highlight areas that require more council funding. This duplicity is echoed by Kitchin et al who state that while dashboards are a multitude of ways to see and understand a city. (Kitchin et al, 2015: 25).
Bibliography:
City Dashboard. (2017). ‘About.’ City Dashboard. Available at: http://citydashboard.org/about.php (Accessed 09/03/17).
Community Insight. (2017). ‘About.’ Community Insight Brighton and Hove. Available at: http://brighton-hove.communityinsight.org/custom_pages?view_page=1 (Accessed 09/03/17).
Few, S. (2006). Information Dashboard Design: The Effective Visual Communication of Data. O’Reilly. Pp.34.
Kitchin, R., Lauriault, T. P. And McArdle, G. (2015). ‘Knowing and governing cities through urban indicators, city benchmarking and real-time dashboards.’ Regional Studies, Regional Science. 2 (1). Pp.6-25.
Leszczynski, A. (2016). Speculative futures: Cities, data and governance beyond smart urbanism. Environment and Planning A. 48 (9). Pp.1694.
Open Data Institute. (2017). ‘What is open data?’ Open Data Institute. Available at: http://theodi.org/what-is-open-data (Accessed 09/03/17).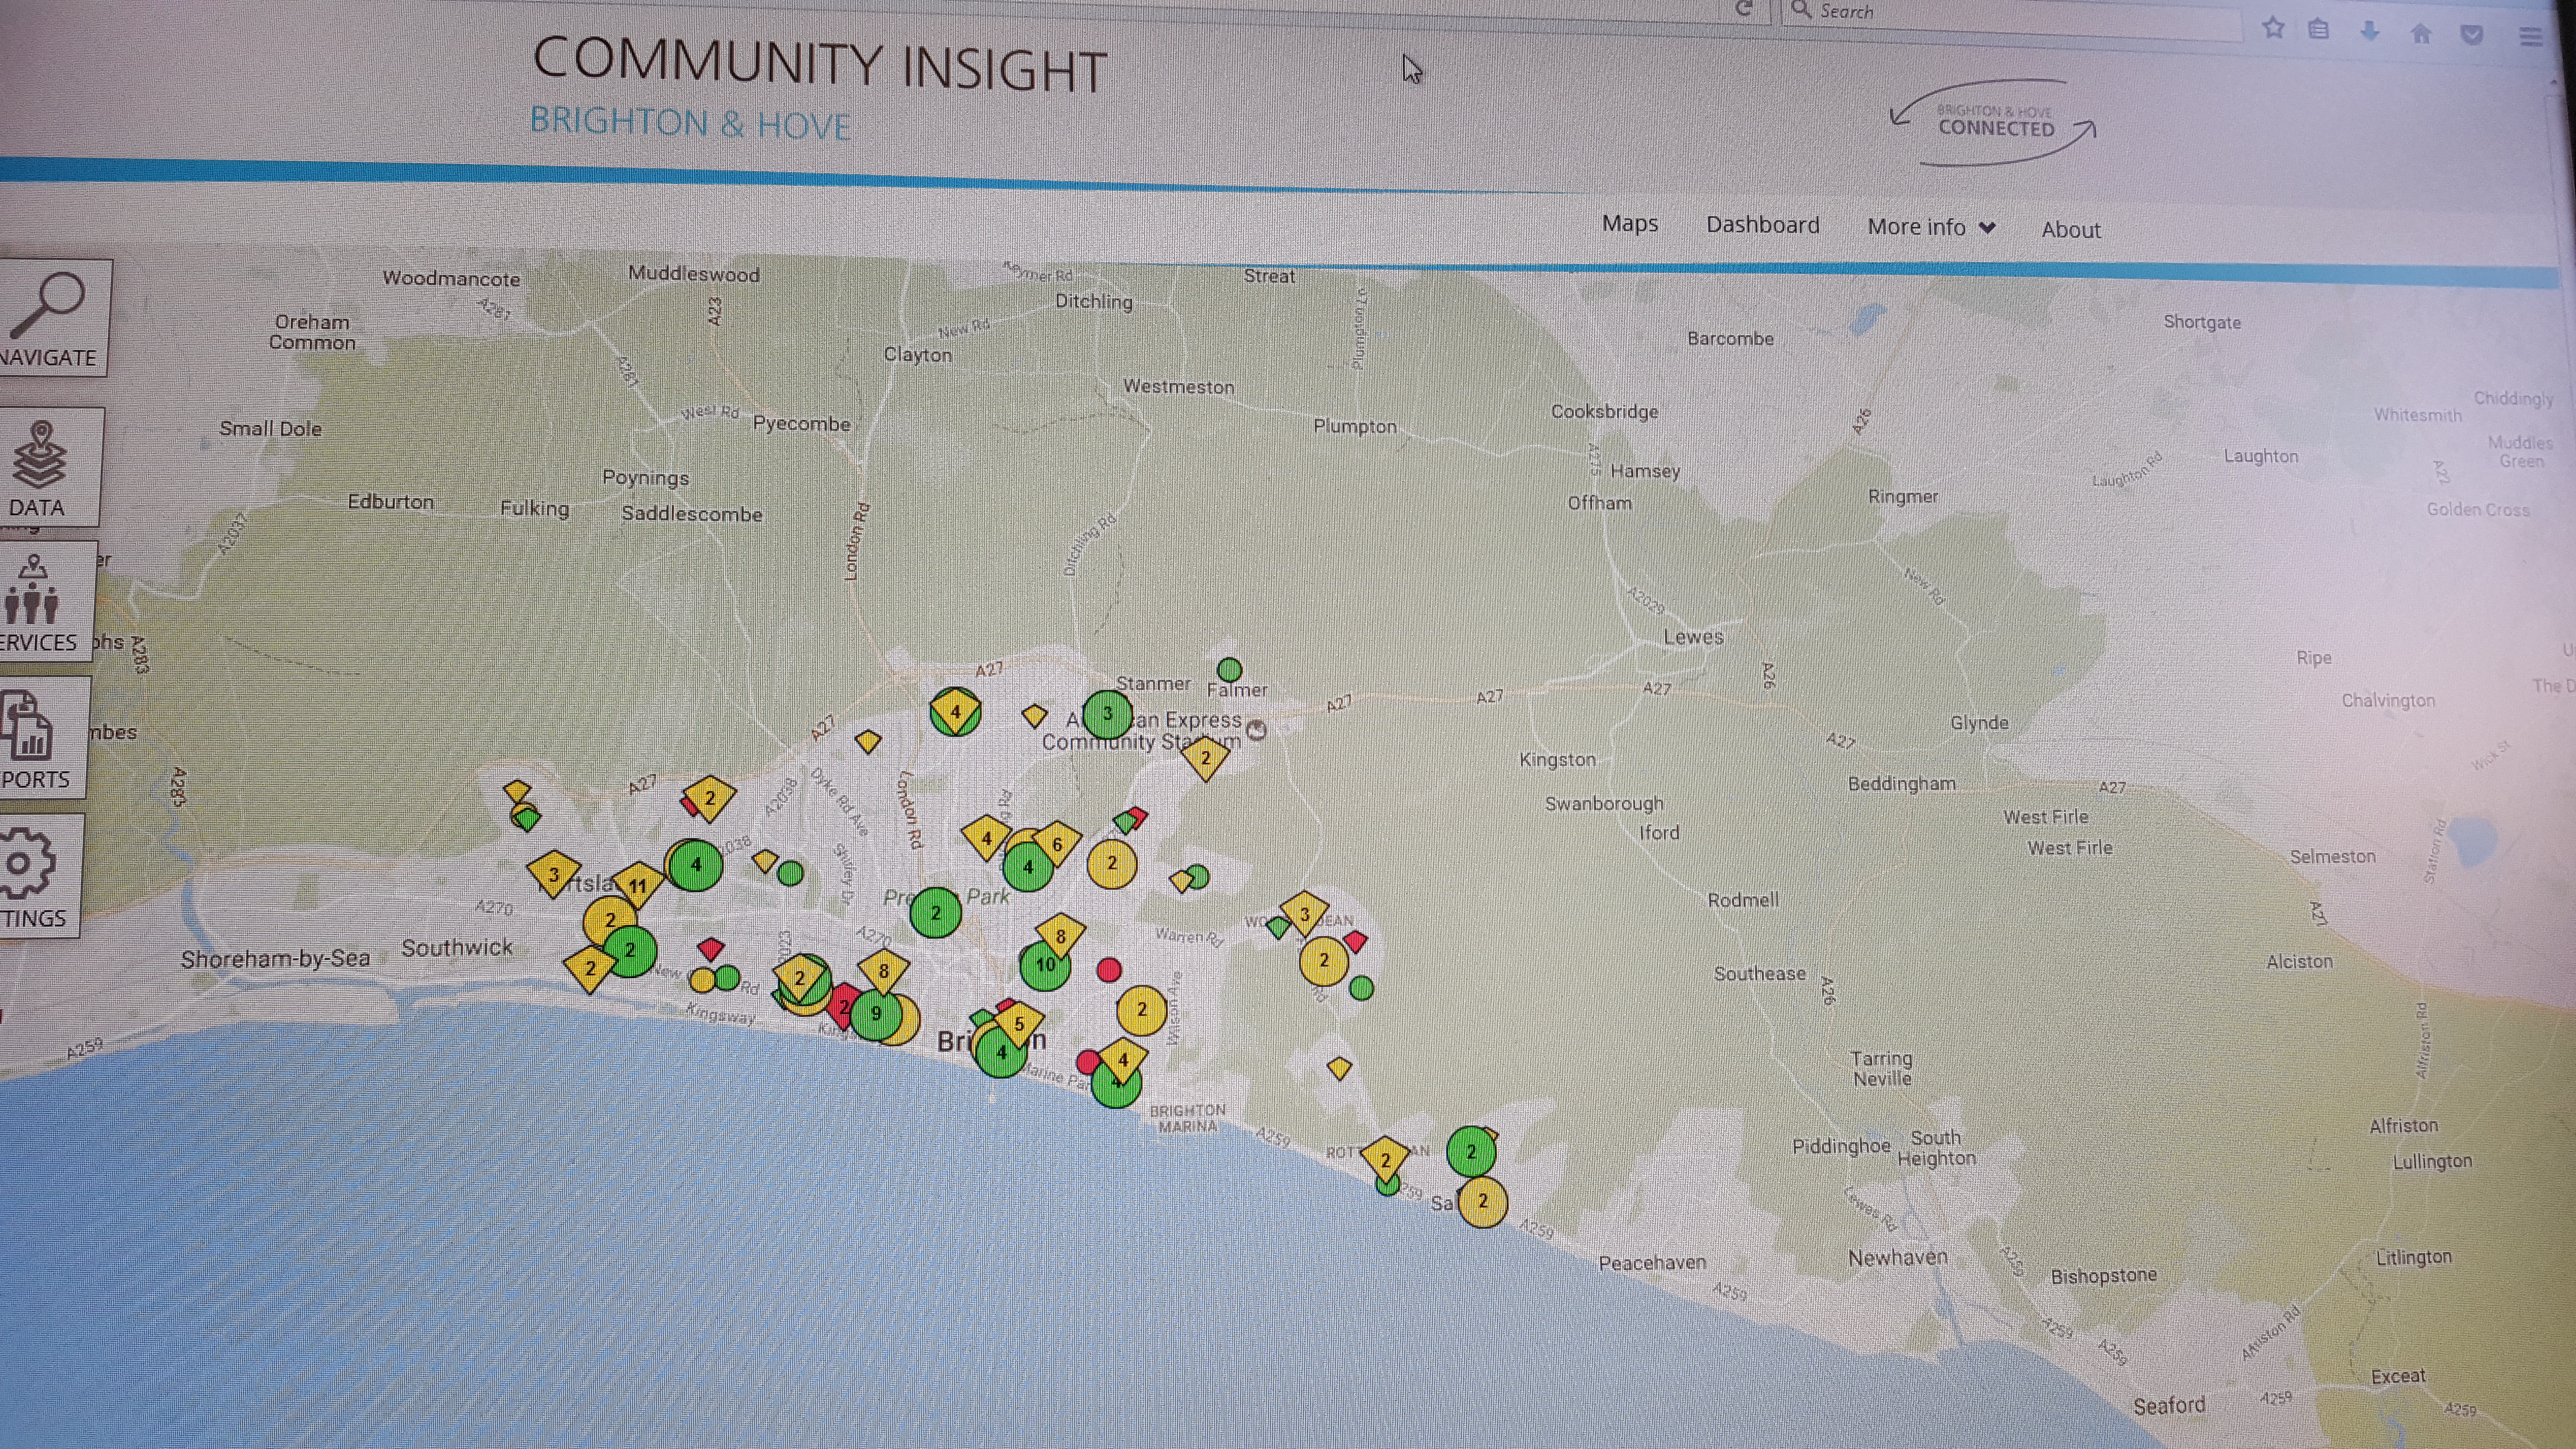

Kitchin et al. state that city dashboards actively frame and produce cities rather than reflecting them. (Kitchin et al, 2015: 6). City dashboards gives people opportunity to access, use and share information. If according to Kitchin, it frames the city however as stated by Hicks-Logan this process can also have a disadvantageous effect by encouraging stereotypes (Hicks-Logan, 2017). This is due to fact that the information that city dashboards provide range from education, health, transport and even crimes. In certain areas when crime is highly and documented, the availability of the information can negatively label the area. Hence once can say that city dashboards can both positively and negatively impact a city
References
Hicks-Logan, G. (2017). City Dashboards and Open Data. [Blog] Digital cities. Available at: http://blogs.brighton.ac.uk/digitalcities/2017/03/11/w6-city-dashboards-and-open-data/ [Accessed 17 Mar. 2017].
Kitchin, R., Lauriault, T. P. And McArdle, G. (2015). ‘Knowing and governing cities through urban indicators, city benchmarking and real-time dashboards.’ Regional Studies, Regional Science. P 6-25
Data gathered by city dashboards has been used to produce information, which measures the performance of a city. This data has been used by different actors, from public bodies to private companies, it can help to provide funding for deprived areas or rate an area for visitors to the city. The Open Data Institute believes that this information will “benefits citizens and economies” (Hicks, 2017).
However, as Kitchin et al describes the data gathered can be produced in different ways “how we conceive of data, how we measure them and what we do with them actively frames the nature of the data ” (Kitchin et al, 2015. PG 16). An example of this would be a data set that has been used by both a public body to raised funding for a deprived area. If the same data set was used by private company to rate a city this “information could have a detrimental effect on an area by producing stereotypes”. (Hick, 2017).
Bibliography
Hicks-Logan, G. (2017). W6 City Dashboards and Open Data. [online] Digital Cities. Available at: http://blogs.brighton.ac.uk/digitalcities/2017/03/11/w6-city-dashboards-and-open-data/#respond [Accessed 18 Mar. 2017].
Kitchin, R., Lauriault, T. and McArdle, G. (2015). Knowing and governing cities through urban indicators, city benchmarking and real-time dashboards. Regional Studies, Regional Science, 2(1), pp.6-28.
Leszczynski, A. (2016). Speculative futures: Cities, data, and governance beyond smart urbanism. Environment and Planning A, 48(9), pp.1691-1708.