Understanding the true nature of the Gephi Chart
The year 2020 has commenced in the most unexpected direction. With a highly contagious virus spreading rapidly through humanity, many party goers are opting to stay home now more than ever. This paves the gold opportunity for live stream videos to capture larger audiences. However, in order to achieve this using the video analytics collected, The Gephi Chart becomes highly effective. A simple definition of the chart is given by authors Heymann. S & Grand. B.L (2013) who both conclude that Gephi is a generic visualization software tool, that analyzes data input while providing a complex imagery of various social clusters and how they interact as the output.
Firstly it is essential to deeply grasp the capabilities and magnitude of the software. According to Grandjean. M (2015) a Gephi specialist who supports this way of thinking regards social networks as groups consisting of two components, firstly the actors and secondly the interactions that take place. To dive deeper into understanding the elements of the model Akhtar, Javed & Sengar (2013), go forth into establishing an important distinction within Social Network Analysis (SNA). They states that, SNA is seperated into two perspectives, one being the ego network analysis and the other being complete network analysis. The generic nature of Gephi allows for social media platforms such as Facebook; whereby majority of live videos are streamed on, to be visually examined using node-link diagrams. Node-link diagrams consist of data maps of theorized information, whereby a visual language is created through the use of color and size. The objectives behind this picturial phenomenon are:
- The chart enables the analyst to edit and filter in or out various variables that highlight areas of strength or weaknesses.
- Gephi, allows for information to be used to project the results of possible changes if made.
- Visualization tools such as Gephi, allow for companies to view their data from a new perspective.
Here is a video link on the fundamentals of Gephi
The missing links within understanding live stream video social networks
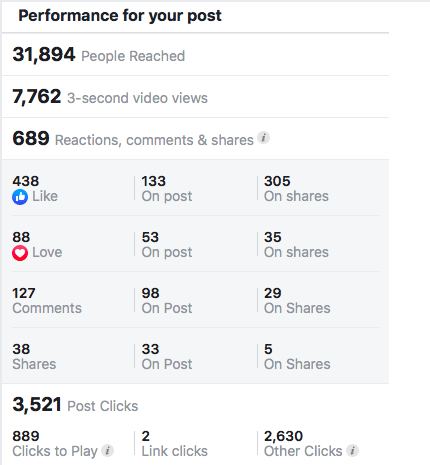
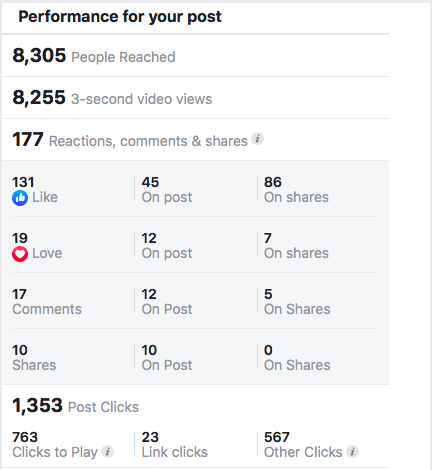
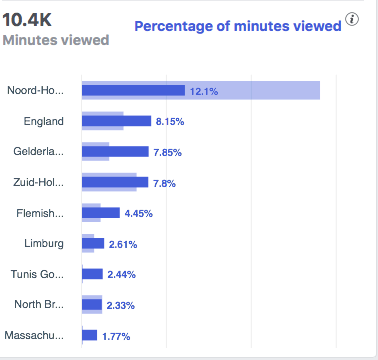
When video streaming is introduced to Gephi, then it is essential to know what is lacking within the knowledge understanding of the various video networks and how live stream companies can effectively utilize the model to decrease knowledge gaps. As previously mentioned, social networks (SN) consist of two methods of evaluating statistics. Firstly, ego network analysis (ENA) is characterised as singular (i.e a person) and focuses on the dominant factors that influence interactions amoung SNs (Smith. J.A, 2019 and Akhtar, Javed & Sengar, 2013 and De Salve. A., et al, 2019). These factors can be viewed as behavioural analytics such as comments, likes, dislikes, hearts and etc. The second method of data interpretation is complete network analysis (CNA). This form of information investigation takes into account geographical locations, user distancing, and effect of distance. In streaming analytics these classifications are found in the video performance analytics, whereby the page owner can select whether they want to see countries where the video was viewed and how many minutes in percentage each place contributed during the live.
When examining video data both, perspectives of SNA are significantly considered to better understand one’s network. These analytics are highly general in how audience engagement and interactions are interpreted. The Gephi chart offers live stream platforms and companies the lack of knowledge bridging between:
- The creation of deeper social networks (SN) based on the different user locations that like, heart, share or comment on a video.
- Understanding the degree of influence or impact various countries have on one another during a live stream or after when live video KPIs are met.
- Determining who the major ego network drivers are & how to utilize these individuals or organizations, to reach far networks focusing on distance to create a greater effect.
Please note: Facebook has discontinued Netlytic API access
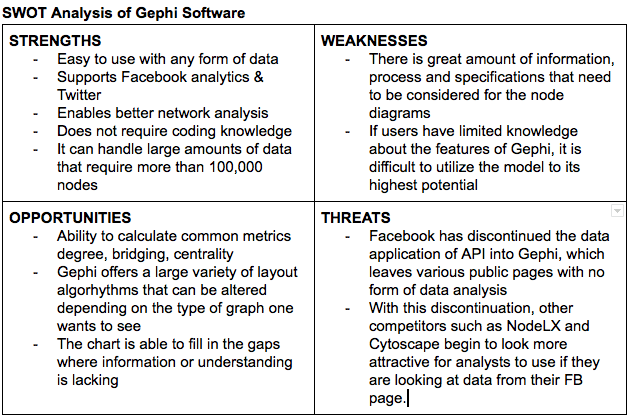
Table 1:
Effective implementation of the Gephi Chart to visualize the social networks of live video data
The Gephi chart and Facebook analytics work very well together to provide a significant picture. When the features and specifications are applied correctly then a visual graph such as the one on the right is created.

Image 1
Furthermore, when implementing live video results generated, establishing key plugins is crucial towards the final visual graph version. Plugins can be viewed as the various filters that input a certain format into how the data is manipulated visually, for example choosing to view country maps for the noting of SN locations (see image 2). These plugins are the dimensions of the overall graph, as each plugin targets a specific category within the appearnce and layout.
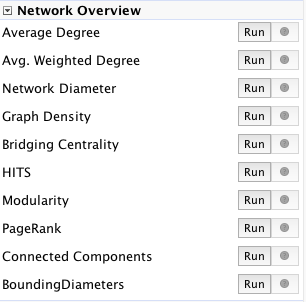 Image 2
How Gephi deepens digital marketing capabilities for live stream videography
Gephi offers deep learning capabilities through the ability of calculating the average (avg) degree of influence between nodes, the avg concentration of bridges between links or size of the network. When geography is connected to the chart, then marketing learning capabilities of the live stream companies are viewed in greater depth. For example, the avg for bridging centrality between SNs and their geographical locations shows the avg distance a live stream network has to it’s external environment. Another illustraction could be measuring the rate of influence one SN has on another against the geo-location to discover the speed at which the live stream is organically circulating once it reaches a SN. There is a plethora of digital marketing tools for live streams yet, are highly limited in their functions and outlook on data. However, Gephi offers exponential solutions to questions and needs that data analysts have or might have in the future.
Image 4
References
Akhtar, Nadeem & Javed, Hira & Sengar, Geetanjali. (2013). Analysis of Facebook Social Network. 451-454. 10.1109/CICN.2013.99.
Arnaboldi, V., Conti, M., Passarella, A. and Pezzoni, F., 2012, September. Analysis of ego network structure in online social networks. In 2012 International Conference on Privacy, Security, Risk and Trust and 2012 International Confernece on Social Computing (pp. 31-40). IEEE.
De Salve, A., Mori, P., Guidi, B. and Ricci, L., 2019. An Analysis of the Internal Organization of Facebook Groups. IEEE Transactions on Computational Social Systems, 6(6), pp.1245-1256.
Facebook (2019) Radio Nachtlab videos [Online] www.facebook.com/radionachtlab/videos/ [Accessed 2 March 2020]
Grandjean, M., 2015. GEPHI: Introduction to Network Analysis and Visualisation.
Gruzd, A., 2020. Netlytic: Facebook is discontinuing API access their Page Public Content [Online] https://netlytic.org/home/?p=11671 [Accessed 27 February 2020]
Gephi (2017) The Open Graph Viz Platform [Online] https://gephi.org [Accessed 1 March 2020]
Heymann, S. and Le Grand, B., 2013, July. Visual analysis of complex networks for business intelligence with gephi. In 2013 17th International Conference on Information Visualisation (pp. 307-312). IEEE.
Smith, J.A., 2019. The Continued Relevance of Ego Network Data.
Youtube (2020) How to download a copy of Facebook Page data info [Online] https://www.youtube.com/watch?v=LIwkkM1TA-4 [Accessed 26 February 2020]