
According to the Open Data Institute, an open data is a “data is data that anyone can access, use or share” (Open Data Institute, 2017). They also state that Open Data impacts everybody and it has proven benefits for our economies and citizens (2017). The Brighton and Hove council have use open data with the service that they provide via Community Insight service which replaced the Brighton & Hove Local Information Service (BHLIS). The community insight is a service that allows the audience to “find, explore and use a wide range of facts and figures at different geographic levels for Brighton & Hove and the surrounding area” (Community Insight, 2017). Funded by the local council, the service provides information regarding different areas in Brighton and Hove that contribute to the development of the city. The aim of these services according to Kitchin et al., is to actively frame and produce cities rather than just representing them (Kitchin et al., 2015 pg 6)
On the other hand, city dashboard “aggregates simple spatial data for cities around the UK and displays the data on a dashboard and a map” (City Dashboard, 2017). Both case studies display information that are accessible to the audience. These information are proven to be current and relevant. Through these dashboard, “they show how different areas compare with each other on key indicators, with data shown as a matrix or charts” (Community Insight, 2017).
Leszczynski (2016), quoting dodges states that the way code, data and procedures put the city together is physically uneven. This is due to the fact the “softwirisation of the cities have made transparent the way various practices related to the socio-spatial area have been presented to the audience (Leszczynski, 2016: 1694). According to Kitchin, Lauriault and McArdle (2014) the use of indicators has proliferated… and it is well being used to monitor and assess various aspects of cities such as sustainability, wellbeing and /or urban services (pg 6-7).
References
City Dashboard. (2017). ‘About.’ City Dashboard. Available at: http://citydashboard.org/about.php [Accessed 13 Mar. 2017]
Community Insight, (2017). Local Insight. [online] Brighton-hove.communityinsight.org. Available at: http://brighton-hove.communityinsight.org/custom_pages?view_page=1 [Accessed 13 Mar. 2017].
Kitchin, R., Lauriault, T. and McArdle, G. (2015). Knowing and governing cities through urban indicators, city benchmarking and real-time dashboards. Regional Studies, Regional Science, 2(1), pp.6-28.
Leszczynski, A. (2016). Speculative futures: Cities, data and governance beyond smart urbanism. Environment and Planning A. 48 (9). Pp.1695.
Open Data Institute. (2017). ‘What is open data?’ Open Data Institute. Available at: http://theodi.org/what-is-open-data [Accessed 13Mar.2017].
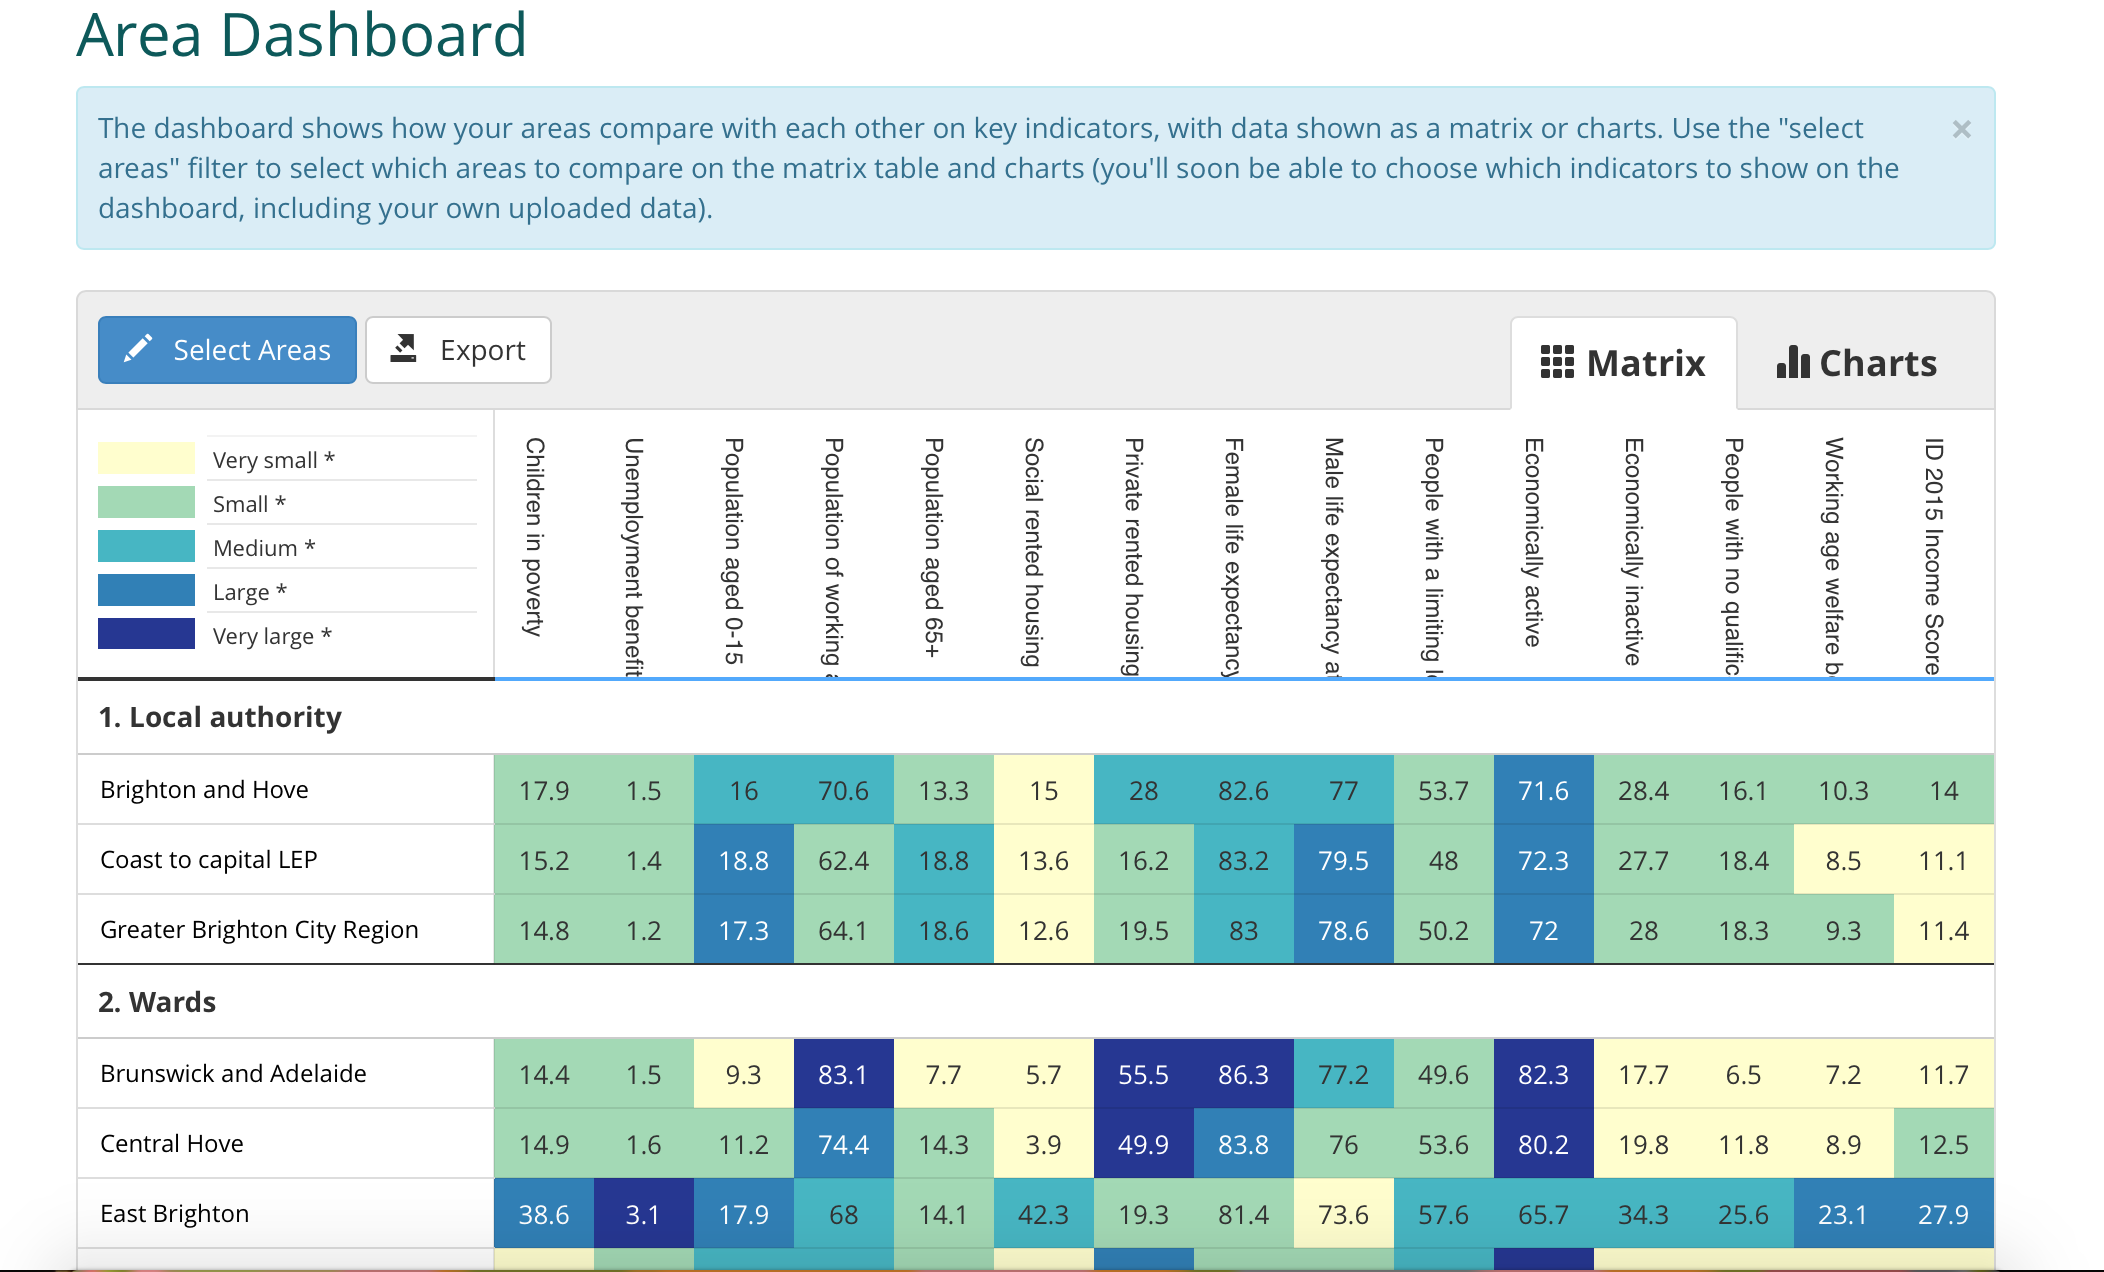

The example of Community Insight, Brighton, appears to be a positive thing that can contribute to the development of the city, representing facts and figures. However, this is simplistic and the use of the word fact is problematic as Kitchin et al explain that this suggests the data can be “abstracted from the world in neutral, value-free and objective ways,” (Kitchin et al, 2015: 16). which is not the case. A city cannot be accurately described through numbers. The data collated by Community Insight, such as the number of unemployed or children living in poverty, could be used for social cleansing or to create negative assumptions of an area where as it may well be a very different experience to actually live there.
Bibliography:
Community Insight, 2017. About. Community Insight. Brighton-hove.communityinsight.org. Available at: http://brighton-hove.communityinsight.org/custom_pages?view_page=1 (Accessed 16/03/17).
Kitchin, R., Lauriault, T. and McArdle, G. 2015. Knowing and governing cities through urban indicators, city benchmarking and real-time dashboards. Regional Studies, Regional Science, 2(1). Pp.16-20.
Data provided by the Open Data Institute, which is free at the point of access, has been used by those wanting to gather information on the Brighton and Hove area, the Community Insights organization has used the information to “find, explore and use a wide range of facts and figures at different geographical levels for Brighton and Hove” (Community Insight, 2017).
While the Brighton and Hove council has used this information to develop a region in the area others have used the dashboard to “show how different areas compare with each other on key indicators” (Community Insight, 2017).
Using data gathered from key indicators to compare different areas of a city maybe deemed bias if the data is not comparing like for like as “indicator initiatives are never neutral, essential, objective, but are rather contingent, relational and contextual” (Kitchin et al, 2015. PG18)
Bibliography
Brighton-hove.communityinsight.org. (2017). Local Insight. [online] Available at: http://brighton-hove.communityinsight.org/# [Accessed 18 Mar. 2017].
Kitchin, R., Lauriault, T. and McArdle, G. (2015). Knowing and governing cities through urban indicators, city benchmarking and real-time dashboards. Regional Studies, Regional Science, 2(1), pp.6-28.
Ngoy, S. (2017). City Dashboards & Open Data. [online] Digital Cities. Available at: http://blogs.brighton.ac.uk/digitalcities/2017/03/14/city-dashboards-open-data/ [Accessed 18 Mar. 2017].